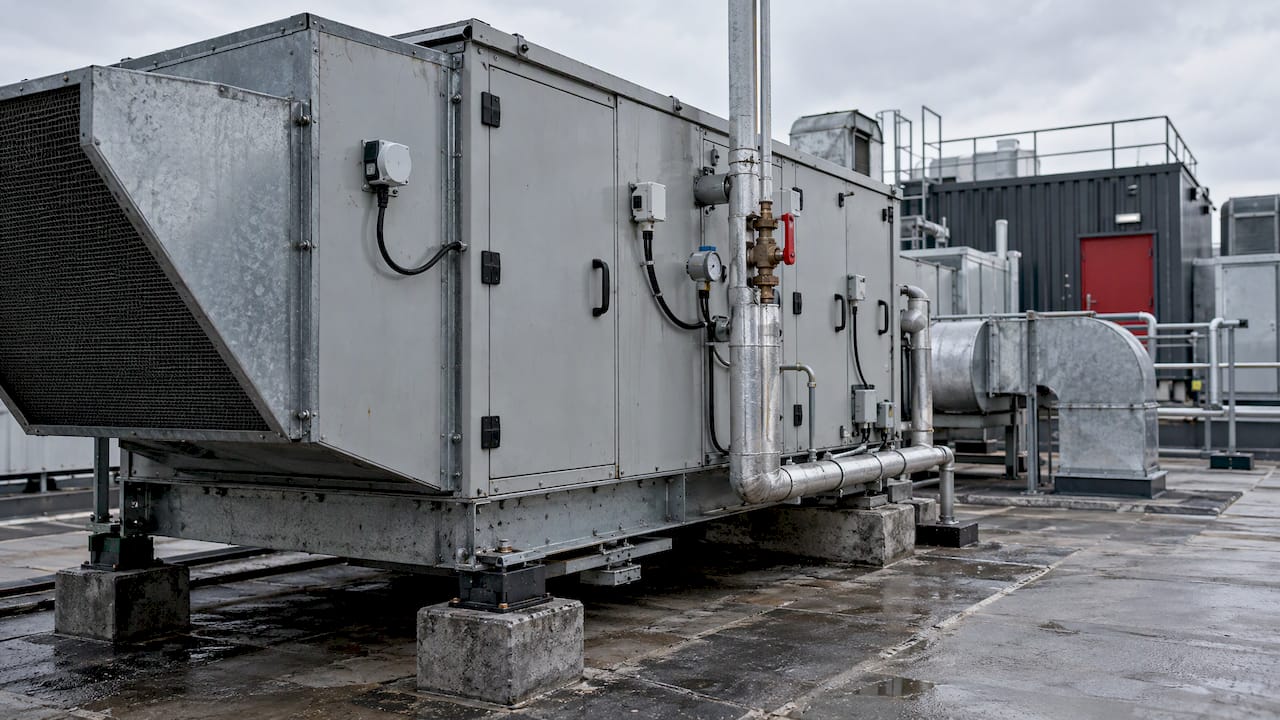
HVAC predictive maintenance analyzes live equipment data, advanced analytics and fault detection alarms to alert you to deteriorating equipment performance before the unit fails. Preventive maintenance lets technicians react on a calendar schedule. Predictive maintenance lets technicians react to hard evidence of pending failure. It's software that works on top of your building management system (BMS). It doesn't replace your maintenance technicians. Here we explain how it works, what data and integrations it requires, discuss savings documented in the field, and show you how to prove your predictive maintenance program is paying for itself.
PODTECH — Let's Make Building Data Work For You
PODTECH specializes in building telemetry and critical infrastructure custom software. We focus on helping teams make better decisions with operational data. Podtech
TL;DR
Predictive maintenance continuously reads sensor and control data, establishes a baseline of normal operating conditions, and detects faults and early degradation.
- You already have most of the data your building needs tucked away in your BMS/building automation system (BAS). Properly cleaned and labelled data is better than shiny new hardware.
- Fault detection users involved in a Lawrence Berkeley National Laboratory (LBNL) field study reported median energy savings of 8%, though the range was broad. Savings are influenced by the actions taken as part of the programme supporting the use of the software.
- Alerts only pay off when they connect to work orders and qualified technicians.
- Monitor it — track alert accuracy, missed errors, prevented failures and energy, and isolate impact from other retrofits.
Table of Contents
- What HVAC predictive maintenance is
- How predictive maintenance uses HVAC data
- What predictive analytics can detect
- Equipment, data and integrations you need
- What benefits to expect
- How to introduce it in an existing building
- Challenges to plan for
- How to tell whether it is working
- Where PODTECH fits
- FAQ
- Sources
What HVAC predictive maintenance is
Preventive maintenance follows a calendar. Filters, belts, coil cleaning and tune-ups occur on a set schedule whether the equipment needs it or not. Predictive maintenance follows condition. Sensors and controls monitor how the equipment is performing and software alerts you when performance degrades.
The US Department of Energy's Federal Energy Management Program calls this condition-based maintenance approach in its Operations and Maintenance Best Practices Guide. Condition-based monitoring gives early warning of incipient failures by integrating online supervision, diagnostics, fault detection, and alarms with real-time reporting of inefficiency.
The practical difference:
| Category | Preventive | Predictive |
|---|---|---|
| Trigger | Calendar or run hours | Measured condition and trends |
| Data needed | Service records | Continuous sensor and BMS data |
| Typical output | Scheduled tasks | Ranked fault alerts and early warnings |
| Main risk | Servicing healthy equipment, missing sudden faults | Poor data, alert overload |
All advanced sites operate both. Prevention maintains the fundamentals and predictive analysis guides you to the units requiring attention first.
How predictive maintenance uses HVAC data
The workflow used by most platforms is summarized by the LBNL review of data-driven fault detection and diagnostics:
- Collect data from the BAS, meters or other sources.
- Cleanse and preprocess it, removing gaps, spikes and mislabelled points.
- Establish a baseline of normal operation for each asset.
- Detect faults when behaviour departs from that baseline.
- Diagnose the likely cause.
- Prognose, where the tool estimates how a fault will progress.
DOE's guidance introduces automated fault detection and diagnostics (AFDD) as software that relies on algorithms to identify equipment- or system-level faults and determine their causes, typically for HVAC systems.
Rules versus machine learning
Rule-based tools take readings and compare them to engineering logic, for example a supply air temperature that never hits setpoint. Data-driven tools take it a step further. The LBNL review defines them as methods derived or trained from data using machine learning or multivariate statistical analysis. Rules are simple and easy to implement. Machine learning can detect nuanced multi-variable relationships but requires access to large amounts of quality data and must be interpretable by the technician receiving the alert.
What this looks like at scale
Carrier's published example illustrates the scope of data involved. In this AWS case study, each unit had sensors providing readings on 90 different things such as RPM, temperature and pressure. Data volume was approximately 8 million readings per unit per day. Carrier set up prediction as a binary classification problem: will this unit fault within the next 60 days? Carrier reported that slow degradation might take more than 60 days to result in failure.
That scale won't come from one building. The moral is simple: sensor data is inexpensive to generate and difficult to turn into something valuable.
What predictive analytics can detect
DOE claims that AFDD can detect a wide variety of problems: improper scheduling of air handling units (AHUs), optimizable setpoints, equipment/component failures, degradation of performance, design and controllability problems, operator overrides, and incorrect sequencing of operation.
For example, at the equipment level the DOE lists such faults as restricted airflow, improper refrigerant charge, liquid-line restrictions, fouled evaporator or condenser coils and non-condensable gases trapped in the refrigerant. Source: air conditioner diagnostics guideline.
Some of the most expensive issues aren't mechanical at all. A unit running all night due to a schedule mistake, a setpoint battling its neighbor, or an override forgotten for months — these all squander energy without causing equipment to fail. Creating a robust commercial maintenance schedule is good practice for any building system, and analytics provides a real-time verification that the schedule and control sequences are being executed.
Equipment, data and integrations you need
You rarely need to start by buying sensors. Begin with what you already have.
- A BMS or BAS that trends data points from chillers, AHUs, fans, pumps, valves and zone controllers. Refer to our glossary page for building management system.
- Metering for electricity, chilled water and heat, so energy effects are visible.
- Add sensors only where needed — for example motor vibration on critical motors, filter differential pressure, or temperatures on the refrigerant side where missing data blocks diagnosis.
- A predictable data model. The LBNL review observes that both BACnet and metadata schemas like Project Haystack, Brick and ASHRAE 223P can simplify data collection efforts by providing points with predictable names and relationships.
- A secure data path. According to LBNL's research on automated fault correction, two-way secure communications from an FDD tool to the BAS can be established, allowing BACnet/IP data collection and issuing of commands from a server that resides inside the site's firewall.
A published case study about building facilities monitored HVAC data with IoT sensors and a BAS, then leveraged a deep-learning model. The phases included data collection, processing, model creation, notifying of faults, and improving the model. The final step is key: technicians have to correct the model's findings so it can learn.
Data centres and mixed estates
Cooling a data centre is a different problem to comfort cooling. Tighter tolerances, higher heat density and little margin for error make CRAC monitoring critical. Computer room air handlers, containment and liquid cooling are all good sources of telemetry that can be analysed. You can read our glossary entries on CRAH and hot aisle and cold aisle containment, but our article on choosing cooling plant for AI factory deployments explains how heat density changes your monitoring requirements.
What benefits to expect
Be precise about what the evidence says.
A field study by LBNL reported that of 26 organisations implementing FDD across 550 buildings and 97 million square feet of floor space, the median savings realised was 8% across facilities. Individual facility savings ranged from -1% to 31%. LBNL notes that savings cannot be attributed entirely to FDD, as it was often implemented as part of a larger energy-management initiative.
The prize needs to be big enough to matter. According to an ASME paper on bringing automated FDD tools to market, HVAC was using over 5 quadrillion Btu per year and accounted for approximately 30% of total US commercial-building energy at publication.
In homes, DOE's diagnostics guideline states that heating and cooling accounted for approximately 54% of energy consumption in existing residences and field studies showed that more than half of the installed AC systems had major deficiencies. It also states that diligent cooling-system maintenance can cut energy use by as much as 50%. Laboratory testing has shown service and replacement savings of about 30% to 50%. Remember this is residential information. Do not apply these percentages to your commercial plant directly.
Beyond energy, the benefits operators usually look for are:
- Fewer unplanned outages and emergency call-outs.
- Longer equipment life through earlier intervention.
- Better use of technician hours, aimed at the assets that need attention.
- A documented record for compliance and capital planning.
Perspective: the software layer between failure and success
We write software for environments where downtime just isn't possible. Our beliefs about HVAC predictive maintenance stem from that. The model itself is the easy part. The challenging part is the engineering surrounding it: pulling reliable datapoints from a BMS, naming them accurately and consistently, passing them securely, and turning an anomaly into a work order that your technicians trust.
Which is why we tackle it as an integration + operations problem first. Our BMS/PMS integration and datacenter telemetry and machine learning work was built to be complementary so analytics is integrated into the tools your team already works in. An alert that exists on a dashboard your team doesn't look at gets ignored. An alert that pops into your workflow, with context, gets fixed.
We design with the people who use it in mind. User-centred design determines if a facilities engineer trusts a recommendation in the middle of the night. Our teams have shipped 250+ projects and we offer a 99.9% uptime SLA on our managed platforms because a monitoring platform that isn't there when you need it isn't really monitoring at all.
Our recommendation: Pick one plant or one critical room, demonstrate the loop from data to alarm to repair, then scale up.
Harry
How to introduce it in an existing building
DOE's guidance on monitoring-based commissioning states that AFDD value lies in linking analytics to O&M, rather than regarding alerts as a standalone software output. Structure your programme around that principle.
- Choose the subject. Pick some assets that either have high failure costs or energy consumption: chillers, big AHUs, critical cooling serving a server room.
- Audit your points. Check what points are trended, how often, and whether they have names and units that are correct. Do this before purchasing anything.
- Close sensor gaps. Add measurement only where it unlocks a diagnosis.
- Connect securely. Ensure collection is inside your network perimeter and negotiate access rules with IT.
- Baseline. Operate in observation mode for a while to learn the normal behaviour for all seasons and loads.
- Direct alerts to action. Assign an owner, priority and work order template to each alert type.
- Review and tune. Conduct routine reviews of false alarms, missed faults and tech feedback.
DOE's diagnostics guidance proposes a two-tier process for residential jobs: screening inspections and tests performed by trained home-performance contractors, followed by methodical fault-finding performed by experienced HVAC technicians. Apply that same stratification to commercial buildings: automated screening first, detailed diagnosis by a trained professional second.
If you likewise operate production lines or other forms of automated plant, our guide to industrial automation setup outlines a similar step-by-step process, and our predictive maintenance models explainer details how to decide between modelling techniques.
Challenges to plan for
Challenges to widespread deployment, according to the LBNL review include: implementation in operational buildings, data quality/scalability, transferability across sites, interpretability, cybersecurity, data privacy, and user experience.
Data quality. Sensors drifting, dropped points and mismatched naming conventions create false positives. Allow time for data cleaning.
Cybersecurity. The article states that internet-connected BAS networks pose security and privacy concerns. Attacks can lead to occupant discomfort, wasted energy, equipment downtime and grid disruption. Segment networks, limit write access and include your security team in the process from day one.
Alert fatigue. Staff learn to ignore alerts when they receive too many of low value. Rank your alerts by consequence and confidence. Retire alert rules that never result in action.
Skills. Analytics is used in conjunction with technician skills, not instead of them. DOE guidance reminds users that diagnosis still needs to isolate faults that have similar measured symptoms. Corrective work also still needs to be done safely by trained technicians. Refrigerant work in particular should be left to certified technicians.
Scale and lag. Lessons from Carrier's experience: large fleets require substantial data engineering effort. Failure labels can lag predictive signal by months. Models will likely continue to improve as confirmed results are obtained.
How to tell whether it is working
Set metrics before go-live, and be honest about uncertainty.
- Alert precision: the share of alerts that turn out to be real faults.
- Missed faults: failures that occurred without a prior alert.
- Lead time: how far ahead of failure the alert arrived.
- Avoided failures and call-outs: compared with a baseline period.
- Energy: weather-normalised consumption of the monitored plant.
Actual results have been published. Four alerts were sent during the building facilities case study’s 45-day trial period: two actual failures, two false positives. One AHU failure was not detected. Alerts were issued two days prior to site failures. Carrier, with access to over 50 TB worth of historical sensor data, achieved 91% precision with its model. It believed that a preventative inspection triggered by its model would have avoided a lockout within 60 days 81.2% of the time. Lockouts would have occurred within 90 days for 10.4% of cases and 8.4% were false positives.
Two disclaimers about understanding results. First, according to LBNL, savings from measures that are not related can occur simultaneously. Therefore isolate the impact of FDD from other retrofits and operational changes that are taking place at the same time. Second, the ASME paper states that standards for defining accuracy and reliability of FDD have not been established and many commercially available FDD tools have not been independently field-verified. Set your own levels of acceptance and review them with your vendor.
Where PODTECH fits
Integration makes or breaks predictive maintenance. We link BMS, PMS and NMS data together, create telemetry and monitoring layers, and build machine learning models that integrate with your operations. Where to start?
- BMS and PMS integration services to bring plant data into one reliable stream.
- Machine learning development for fault detection and prognosis tailored to your equipment.
- Smart buildings solutions for monitoring and energy management across an estate.
- Legacy modernisation where older controls and software block data access.
Describe your plant and your existing BMS, and we will scope a pilot for you.
Explore our datacenter services or start from podtech.com.
FAQ
Is predictive maintenance the same as preventive maintenance?
No. Preventive maintenance is time-based maintenance. Predictive maintenance is condition-based maintenance. Most facilities do both. They run preventive maintenance for the basics and have condition analytics to guide maintenance technicians to the machinery that is trending away from norm.
Do I need new sensors to start?
Rarely. Most buildings have enough BMS points trending already to start fault detection. Install sensors only if you need data for a specific diagnosis that you are missing, such as vibration on an important motor or pressure differential across filters.
How much energy can it save?
Median savings across the 26 organisations evaluated by LBNL was 8%. Individual results ranged from -1% to 31%. Results will vary based on the building, available data, and how rapidly teams respond to issues identified by the software.
Is it safe to connect HVAC controls to analytics?
Yes, if you plan accordingly. Store your data collection behind the site firewall, restrict write privileges and segment your network. Since cybersecurity is treated as a primary concern in LBNL's review, make sure to bring your IT and security groups into the conversation early.
Does it replace HVAC technicians?
No. Analytics prioritises problems but technicians still diagnose problems with common symptoms and perform repairs safely.
Sources
- Operations & Maintenance Best Practices Guide, Release 3.0 (DOE FEMP)
- A review of data-driven fault detection and diagnostics for building HVAC systems (LBNL)
- Enhancing Performance Contracts with Monitoring-Based Commissioning (DOE)
- Measure Guideline: Air Conditioner Diagnostics (DOE Building America)
- How Carrier predicts HVAC faults using AWS Glue and Amazon SageMaker
- Building fault detection and diagnostics: Achieved savings (LBNL)
- Bringing Automated Fault Detection and Diagnostics Tools to Market (ASME)
- Predictive Maintenance in Building Facilities: A Machine Learning Approach
- From Fault Detection to Automated Fault Correction (LBNL)