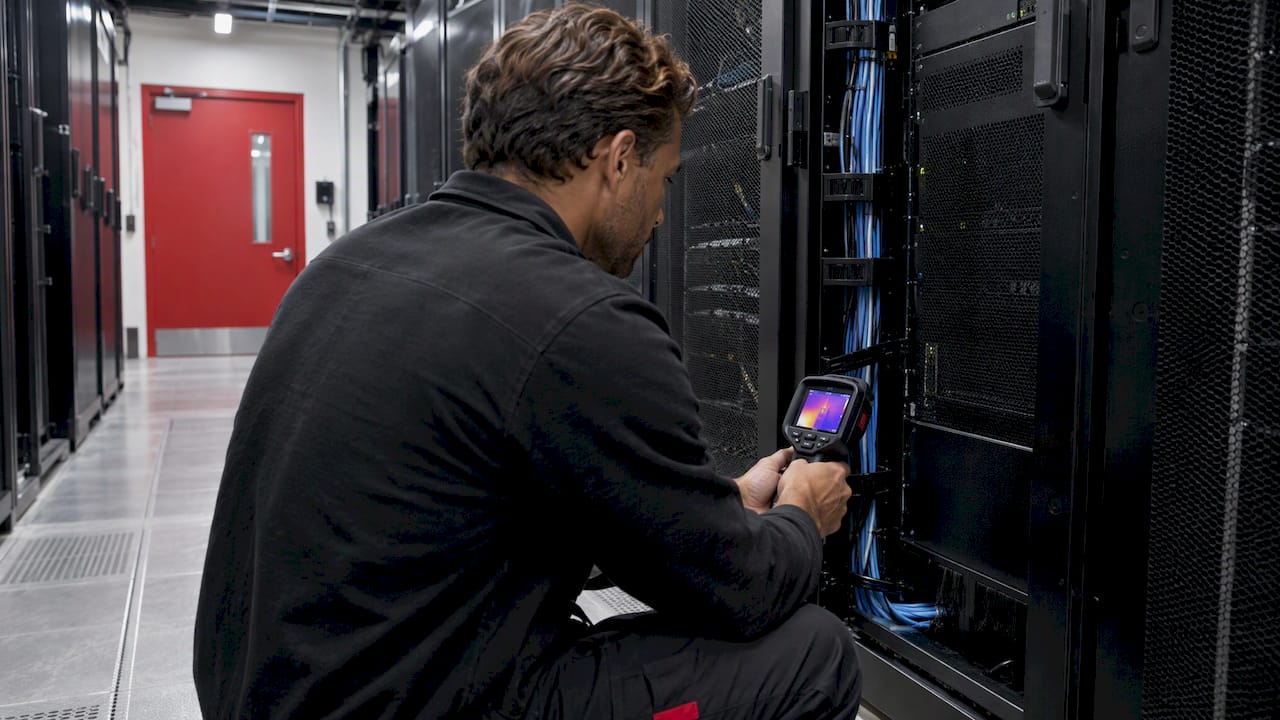
By converting the temperature profile of a data center to an image, you are able to identify hot spots, areas of inefficient cooling and your available additional power density. Performing a thermal map once will allow you to benchmark the facility. If you repeat the process regularly, it provides a powerful mechanism to manage and optimize your cooling system. We develop the telemetry required to enable this. This article describes our approach, what you should aim to achieve and some key metrics.
Turn Thermal Data Into Clearer Decisions
PODTECH develops telemetry and monitoring solutions for data centers and smart buildings.
VisitTL;DR
- You require multiple readings across the room to create a meaningful thermal image. An individual room temperature will tell you very little.
- Start by looking at the temperature at the IT equipment intakes. Per ASHRAE, the target range is 18-27°C (64.4-80.6°F) for equipment classes A1-A4.
- As a minimum, place a sensor at the base-front, top-front and top-rear of each rack. You may be able to reduce this in certain deployments.
- Identify persistent hot and cold areas. These indicate restrictions to airflow, recirculation or unnecessary cooling being applied.
- Repeat the thermal image following any works. Once established as a baseline, you have a tool to drive optimization of your cooling plant.
Table of Contents
- What thermal mapping is, and what a room average hides
- Targets: what “good” looks like on the map
- How operators map a room: sensors and imaging
- Reading the map: hot spots, cold spots and airflow faults
- Managing cooling capacity with the map
- Common mistakes
- Where higher densities change the picture
- How PODTECH supports thermal mapping
- Our view
- FAQ
- Sources
What thermal mapping is, and what a room average hides
As described above, you can represent the temperature, and frequently other parameters such as flow, RH and static, of the space occupied by IT assets, aisle(s) and individual racks. The objective is to obtain a picture of these values.
An individual temperature reading taken for example from the middle of a room will not provide sufficient information. There could be significant variation between rows of racks, resulting in some racks being supplied with above-target temperature and others receiving excessive cooling. A room average can look acceptable while individual intakes are not.
The starting point should be the IT equipment inlet. ASHRAE recommends 18-27°C (64.4-80.6°F) for classes A1-A4, with allowable ranges extending higher depending on class. There are also environmental caveats. For example, the maximum permitted inlet temperature reduces by 1°C for every 300m increase in elevation from 900m for classes A1, A2, B and C. Depending on the location of your facility, you may therefore need to revise your upper target temperature. See our page on ASHRAE classes.
From the above, we draw two conclusions:
- The US Department of Energy's Data Centre Best Practice Guide was published in July 2024. Among other recommendations, it states that the chilled water supply temperature should be dictated by the highest IT intake temperature in the room. A thermal image based on intake temperatures allows this to be assessed.
- In its publication on improving the cooling efficiency of AI data centers, ASHRAE recommends operating at the upper end of the applicable recommended range, and implementing high-resolution monitoring at the equipment intakes.
As noted, thermal mapping and increasing the cooling efficiency of your site are closely linked. You need to know the highest temperature being drawn into your plant to increase your supply temperatures.
Targets: what “good” looks like on the map
A useful thermal map is not simply a colorful picture. It should tell you whether rack intakes are staying within the recommended band, whether cold air is reaching the top of the equipment, and whether exhaust air is being kept separate from supply air.
In practical terms, a good result usually means:
- Rack inlet temperatures remain within the intended ASHRAE range.
- Top-front temperatures do not drift materially above lower-front temperatures, indicating that cold air is penetrating the full rack height.
- Persistent hot spots are absent, or at least understood and controlled.
- Cold regions are minimized, because they often indicate overcooling rather than useful spare capacity.
- Cooling plant set-points can be raised without pushing critical intakes beyond the recommended limit.
The map is therefore not an end in itself. It is a decision tool for airflow management, set-point optimization and capacity planning.
How operators map a room: sensors and imaging
Broadly speaking, there are 2 approaches to taking a thermal image. Established facilities will usually employ some combination of the following:
Sensor arrays at fixed locations
Using permanently mounted sensors will give you a time-series dataset, allowing you to observe trends and trigger alerts. The key consideration is the number and placement of these devices.
The ENERGY STAR website notes that "in practice, 3 measurement points [per rack] have been found to be adequate".
- Bottom front, for the incoming cold air, preferably with some airflow measurement.
- Top front, to ensure the cold air penetrates to the highest part of the equipment.
- Top rear, usually the point of greatest heat in the rack.
The top front will pick up any air that recirculates. This may be due to the exhaust turning over the rack, or the last rack in a row, and feeding back into the front of the next. A measurement at the only available bottom position would miss this entirely.
Lower density data centers. An LBNL publication from 2020 on Data Center Thermal Guidelines found that for lower densities, only approximately 10% of the sensors would be required while maintaining very high fidelity. Their suggestion was to place sensors on the face of the perforated door of each alternate, or third, rack. This provides robustness to regular reconfiguration of racks, which a strictly device-based scheme would lack.
Large scale application. In the LBNL Wireless Sensor Network report (2012), the trial involved 588 sensors: 420 for rack temperature, top, mid and bottom, to measure both IT intake and exhaust; 60 for RH and temperature; 18 for static and differential pressure; and 11 for electrical. Of course, knowing the temperatures is necessary but not sufficient to understand the air movement through the data center. The various pressures in and around the floor will give key indications.
Thermal imaging
Thermal imaging will capture all temperatures within the frame. As such, it is ideal for highlighting areas of leakage, for example around cabling, floor penetrations, doorways, sweep seals and similar points, as well as identifying high-resistivity connections in the switchrooms, UPS and PDU rooms.
Because it will only provide a single image, it should be used in conjunction with continuous temperature points. Further discussion of the respective benefits of thermal imaging vs. temperature points can be found here. In general, the former can be used to identify suitable locations for the latter.
Reading the map: hot spots, cold spots and airflow faults
There will inevitably be multiple high or low temperatures identified, but these need to be seen in context. For example, if the whole data center undergoes a major intervention, then individual anomalies will occur. More concern should arise if these features persist.
From the resulting map, some of the following may be evident:
| Observation | Possible reason(s) | Immediate action(s) |
|---|---|---|
| High temps at top front of rack(s), but not at bottom | Recirculation above individual rack(s) or end of row | Check blanking, air containment, end-of-row closure |
| Single rack high in row of low temp | Insufficient or excessive air being supplied to that rack | Review perforated tile layout, distribution of equipment, cabling |
| Entire row high, remainder low | Poor distribution of primary air, or blockage beneath floor | Investigate floor plenum conditions |
| Low temp region, but relatively little equipment | Excessively low air supply | Review primary air supply level, secondary system operation |
| Return high, intakes low | Significant quantities of air bypassing the plant | Check floor cut-outs and inadequate tiling |
As mentioned above, cabling in the floor void will reduce the volume of air able to pass and lead to localized high temperatures. Furthermore, the raised floor should allow an effective working height of no less than 24 inches. If rows of elevated temperature are apparent and the floor void is heavily occupied with cabling, there is likely a straightforward remedial action.
Similarly, a low-temperature region does not automatically represent unused capacity. You may simply have an over-supply of cooling, or insufficient control over it. Either is a valid conclusion from the map.
Managing cooling capacity with the map
Having reduced the data center to a map of hot and cold areas, the next step is to convert this to one or more quantifiable metrics.
- Return Temperature Index (RTI) was defined in a further LBNL publication (2014) relating to the use of wireless mesh sensors. The ratio of the primary plant's delta-T to that of the rack intake and exhaust identifies the presence of any significant levels of recirculation or air bypass. Note that no direct airflow measurement is made.
- Rack Cooling Index (RCI). The DOE Air Management Tool user manual (Dec 2021) defines a high RCI of 100% as corresponding to the condition where no rack intake is above the target maximum temperature. Below 90% is considered unsatisfactory. Where both the high and low RCI values are 100%, then all intakes lie within the desired band. This metric is presented as a means of validating that any actions taken to improve plant efficiency have had no detrimental effect on the data center thermal profile.
It is therefore the metric that will enable increases to the primary plant set-point.
Controlling the amount of cooling provided
This process should be ongoing and cyclical:
- Take a comprehensive baseline of the data center, capturing inlet and outlet temperatures at multiple points in each rack, over a sufficiently long duration to include typical daily variations.
- Address the obvious deficiencies such as blanking, sealing, tiling and excessive cabling. Repeat the mapping.
- Increase the plant set-point until the critical rack intake is approaching the upper limit of the recommended range. One source recommends a working set-point of 77-79°F, taking the maximum value of 80°F as a starting point for applying the above methodology.
- Decrease the provision of secondary cooling, for example by reducing the speed of fans or switching off some plant, subject to maintaining a satisfactory high RCI.
- Headroom — Once the intakes are known, you can establish the additional load each hall will accommodate until the peak hot intake reaches its maximum.
- Trend — Leave your sensors in place. Whether this is due to a fresh installation, rack relocation or loss of capacity, you'll be able to identify the impact via a trending analysis.
Example outputs
A detailed example is provided in the LBNL paper from 2012. Following the introduction of wireless sensors and a suite of optimization initiatives, the customer achieved a 48% reduction in cooling demand and 17% overall site consumption, equating to 657MWhp.yr savings. This also translated to a reduction in CO2 output of 542 tonnes per annum.
Of course, your site will vary and will provide differing levels of opportunity. However, it provides good evidence of the benefits that can be gained. Please refer to our blog post on PUE determination to reporting standard and the definition of DCiE for further information.
Common mistakes
- Focusing solely on return air. While informative, this gives an indication of the load on the CRACs rather than the actual heat load imposed on your IT equipment.
- Static snapshot. Any movement of racks will invalidate your map.
- Missing key information to accompany the map. For example color bar, time taken, technique used and IT load.
- Sensor deployment not fit for purpose. As discussed above, any change in IT configuration will affect your map. The limited number of door sensors is therefore unlikely to meet your requirements.
- Overlooking the electrical distribution assets. Switchgear and PDU contactor failure points may contribute to downtime but are invisible to your thermal survey.
- Not considering your CRACs. Any operation beyond the intended specification of the units will manifest itself on your survey. See our glossary article on CRAH for details of the relevant unit types.
Where higher densities change the picture
With increased rack density, there are stricter constraints on the available airflow. The conditions sufficient to cool a typical 8kW rack may prove wholly inadequate at 30kW, and if introducing liquid cooling then further instrumentation will be required.
Furthermore, should your plans include AI, please see our article on supporting AI factories and our development of a rack-based fan control solution for 100kW+ equipment. Your thermal survey must be capable of supporting these increased data rates and alarm settings.
How PODTECH supports thermal mapping
It stands to reason that the value of your thermal survey will be diminished if you have to collate and analyze multiple datasets. Through our range of Datacenter Telemetry, Containment Monitoring, Wired and Wireless Sensors, Monitoring Platform and POD View Liquid Monitoring, and associated DCIM and BMS/PMS services, we can consolidate the temperatures at, and around, individual racks and wider plant into a single interface.
Details of our offering are available here, and we can share an example via our case study.
From a simple requirement to deploy sensors across your data hall or halls and monitor them in real-time, please get in touch via Products.
Having completed 250+ installations to date, we offer an industry leading 99.9% availability guarantee and worldwide coverage. Your thermal survey should reflect this to ensure that you have appropriate assurance during critical periods. We also provide specialist BMS and PMS integration for customers looking to tie their survey into wider site automation.
Our view
In almost all instances, there is ample cooling capacity within the space. The problem is typically that there is insufficient insight. An average reading across the hall may mask significant pockets of over- or under-cooling. Only by measuring the immediate environment of your IT will you know.
Therefore, our philosophy is: conduct a thermal survey at rack face, continue to monitor the state of the hall and use the findings to dictate your CRAC set points. You will receive an action plan from the initial exercise, and ongoing monitoring will allow you to determine your available load.
As such, we provide a coherent suite of products covering Datacenter Telemetry, Containment Monitoring and DCIM. From detecting a local hotspot to preventing a catastrophic event, the intervening IT system relies on high-quality inputs, and we seek to enable our clients to utilize this effectively.
Harry
FAQ
At what temperature should my data center operate?
For data centers classified as A1-A4, ASHRAE recommends that the inlet temperature is maintained between 18°C and 27°C (64.4-80.6°F). Depending on the classification, higher maximum temperatures are permitted; 32°C and 35°C for classes A1 and A2 respectively. Note that you should be measuring at the IT equipment inlet.
How many sensors should I install?
Typically 3x per rack, lower, upper-front and upper-rear, would form a reasonable baseline. LBNL's findings suggest that significantly fewer, by approximately 90%, can suffice, with sensors placed on the front face of alternate or tri-racks. You should consider how frequently you expect to modify your IT configuration.
Will thermal camera surveys suffice?
A thermal image provides an instant picture of your data centre, allowing quick identification of, for example, water leaks and high-current connections. However, there is no historical data to show development over time. In practice, thermal cameras will typically be used in conjunction with permanent sensor racks which provide continuous monitoring and alerting.
When should I update my thermal map?
Any addition of servers, cabling, physical modifications and changes to operating temperatures should prompt a new thermal mapping. Using continuous monitoring, this can be performed on-going, with post-change analysis of the recorded data.
Sources
- ASHRAE Thermal Guidelines reference card, 2021
- DOE Best Practices Guide for Energy-Efficient Data Center Design, July 2024
- ASHRAE: Energy and Thermal Efficiency, AI Data Center
- ENERGY STAR: Use Sensors and Controls
- LBNL: Thermal Guidelines and Temperature Measurements, 2020
- LBNL: Wireless Sensor Network for Improving Energy Efficiency, 2012
- LBNL: Wireless mesh sensor guide, 2014
- DOE Air Management Tool user's manual, December 2021