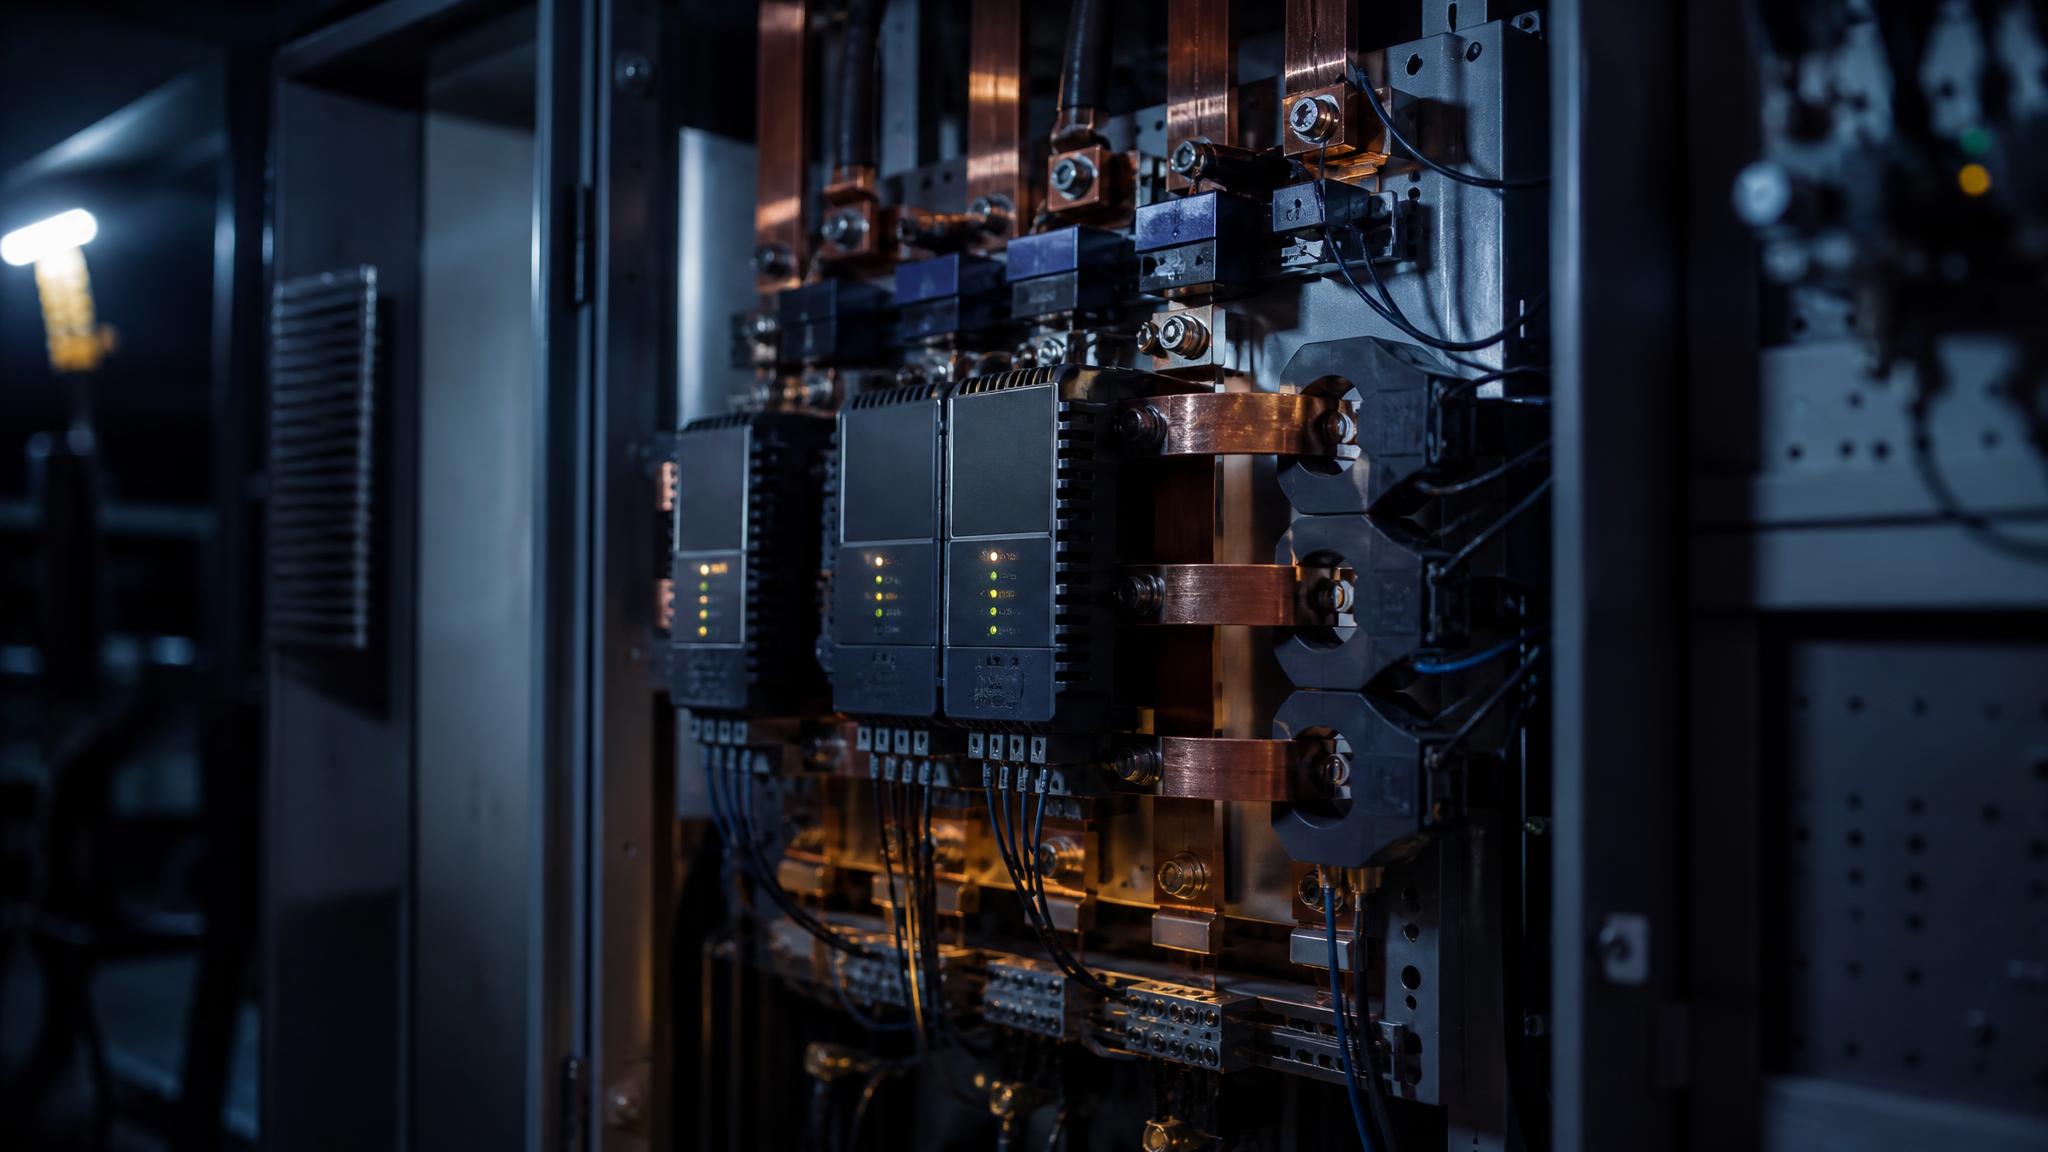
Power quality monitoring involves selective measurement of voltage, current and related parameters with the intent of identifying and quantifying voltage sags, swells, interruptions and other disturbances that may cause equipment damage or production loss. The immediate question is how to approach it: a quick diagnostic survey with a portable analyzer for an existing problem? Or installation of a permanent Class A meter where high-value loads justify continuous data logging. In either case we apply the same discipline of measurement, as specified in IEC 61000-4-30 and IEEE 1159.
TL;DR:
- Portable analyzers are not good for long-term monitoring as seasonal or intermittent power events could be overlooked.
- Permanent metering makes sense for mission critical loads, but can get expensive when you have many meters.
Voltage sags, transients, harmonics, flicker and unbalance should never be measured independently of each other.
- Device selection must be made according to sampling rate, measurement class, and type of sensor. IEC 61000-4-30 Class A serves as the baseline for comparison.
- Combining portable surveys, permanent meters and analytics can enhance long-term power reliability and enable predictive maintenance.
Monitoring Infrastructure Operations Made Easy
PODTECH creates custom software, telemetry and analytics platforms that allow clients to watch their vital assets and processes while empowering smarter operations decisions. Learn how PODTECH can help
Table of Contents
- Types of power quality monitoring devices and where each fits
- Key power quality parameters to measure and why they matter
- Selecting instruments and sensors: practical criteria
- Deployment best practice: locations, duration and triggering strategy
- Data handling, standards and formats for trustworthy results
- Interpreting results and common signatures: what typical problems look like
- Troubleshooting and corrective measures (economics first)
- Impact of power quality problems on equipment and operations
- Overview of power quality mitigation techniques
- Comparison of portable versus permanent monitoring solutions
- PODTECH perspective: integrating PQ telemetry into wider operational monitoring
- How PODTECH can help
- Sources
- FAQ
Types of power quality monitoring devices and where each fits
Choice of instrument depends on exactly what question you're trying to answer. A portable recorder is good for trending over days or weeks of operation, and suffices for a general purpose diagnostic survey. A bench analyser can be left running on a single panel providing highly detailed real-time readouts, and is good for commissioning work or troubleshooting. Permanent power quality meters permanently wired into switchgear give continuous visibility into one or more critical circuits, often with alarm conditions fed back to a building management system. Phasor measurement units (PMUs) record synchronised, high-resolution voltage and current phasors — these are used almost exclusively by utilities and large industrial sites measuring grid-level power system stability. Basic data loggers sacrifice resolution for lower cost and longer battery life. Coarse energy/voltage trending can be done with a data logger, but they cannot capture transients.
- Portable recorders: short-term diagnostics, rented or owned, typically 4 to 16 channels.
- Bench analysers: live troubleshooting, harmonic spectra, power factor on the spot.
- Permanent meters: continuous monitoring on switchboards, UPS inputs, generator interfaces.
- PMUs: synchronised phasor data for grid-interactive or multi-site correlation.
- Data loggers: low-cost, long-duration trend capture with limited event detail.
Suitability to task. Troublesome one-shot trip on a production line means you need a portable analyser with precise triggering capabilities. Data centre or hospital feeder where you can't afford surprises means you need a permanent solution.
Key power quality parameters to measure and why they matter
Voltage sags, swells and interruptions are characterized by both magnitude and duration. A sag of a few cycles can cause a variable-speed drive to trip; an interruption lasting several seconds can trip an entire process line. Transients and impulses occur in microseconds, so their capture requires high-bandwidth sampling instead of the conventional half-cycle RMS measurements made for sags.
Harmonic distortion, quantified as total harmonic distortion or THD, can cause motor winding heating, transformer derating, and can excite resonance conditions with capacitor banks. Flicker and voltage unbalance are silent killers: voltage unbalance is prevalent on three-phase feeders and can significantly reduce motor efficiency and cause reduced motor life over time, even when nameplate voltage appears acceptable during a brief spot measurement.
- Sags, swells and interruptions: magnitude and duration drive equipment tripping thresholds.
- Transients: microsecond events requiring high sample rates to catch at all.
- Harmonics (THD): motor heating, transformer derating, capacitor resonance.
- Flicker: visible lighting disturbance, often linked to arc furnaces or welding loads.
- Unbalance: reduces motor efficiency and accelerates winding wear.
Tip: Don't rely on voltage monitoring by itself. Often where SPDs have been installed, voltage waveforms can appear to be tranquil when surge currents at the connection point are actually telling you a completely different story. Research conducted by NIST shows that by monitoring voltage alone you can easily miss surge events that your SPDs are silently suppressing. By utilizing both voltage and current channels you will see a much clearer picture.
Selecting instruments and sensors: practical criteria
Specify to the disturbance you need to see, not to a generic spec sheet.
- Sampling rate and bandwidth: harmonic distortion analysis through 50th order requires a few kHz while transient capture requires high microsecond scale sampling to prevent false negatives on brief spikes.
- Measurement class: wherever possible specify IEC 61000-4-30 Class A. This is the highest measurement class and should be specified where the results will be used to make contractual or compliance decisions.
- Sensors: clamp CTs for general purpose current sensing, Rogowski coils when flexibility and clearance around bus bars is important, HF current probes for transient work.
- File format: the file format PQDIF (IEEE Std 1159.3) preserves sampling rate, resolution and instrument metadata for archival purposes, as well as export to easy-to-read CSV files for rapid assessment.
Accuracy is expensive. A Class A device with certified CTs will cost significantly more than a Class S logger, and that premium is often worth paying if the data will be used to justify capital expenditure or in a dispute with a vendor.
Deployment best practice: locations, duration and triggering strategy
It's often more important where you take measurements than what measurement device you use. Places that are especially helpful include the service entrance, distribution panel feeders, and critical load interfaces with generators and UPS systems because problems that appear the same downstream may have originated very differently upstream.
How long depends on the question. A few days will verify a repeatable nuisance trip. A few weeks will show weekly load-cycle variation during all shifts. Anything longer than a month starts getting cumbersome to manage. A full year-long data profile is rarely collected during a diagnostic assignment, but NIST warns that extremely severe or disturbing events may occur seasonally or may be rare, so a short monitoring period may simply miss the incident you seek.
- Allow pre-trigger buffers spanning several cycles, to capture waveform leading up to an event.
- Record selectively using rolling capture with reasonable thresholds instead of everything blasting into record all the time and filling storage with noise.
- Synchronise clocks across instruments so events can be correlated site-wide.
- Label channels, phases and locations clearly before leaving site.
- Coordinate outages and CT installation with site operations and safety procedures.
Data handling, standards and formats for trustworthy results
Comparable data requires common methods as well as good equipment. IEC 61000-4-30 prescribes the measurement method for each parameter. Class A is the level to employ whenever the numbers could be questioned. IEEE 1159 provides the Recommended Practice for monitoring along with the common terminology to categorize events. This means a sag on one report will be the same as any other.
- Reference IEC 61000-4-30 for measurement method and class.
- Reference IEEE 1159 for event terminology and monitoring practice.
- Use PQDIF (IEEE Std 1159.3) for interchange and archival across instrument brands.
- Document instrument class, sampling rate, calibration date and channel mapping in every report.
NIST's own guidelines say it plainly: site surveys are device and location specific. Care should be taken when comparing measurements collected under different circumstances. They are not inherently interchangeable.
The one caveat buried in NIST's summary of power quality surveys is why the setup description is as important as the measurement itself. PQDIF was designed for that very reason, to accompany the waveforms with the description so a file opened five years down the road will still have the same meaning as when it was created.
Interpreting results and common signatures: what typical problems look like
Interpreting a trace is recognition of patterns established through repetition. A harmonic spectrum consisting mostly of the 5th and 7th orders generally indicates variable-speed drives or rectifier loads. A single spike near a particular frequency in the presence of capacitor banks likely indicates resonance, not an inherent load issue.
- Recurrent sags at the same time during a shift are usually associated with motor starting, rather than utility faults.
- Swells after clearing a nearby fault typically originate from the utility, not the site.
Fast narrow transients indicate switching, such as capacitor banks or breakers, while slow wide ones are usually lightning-related.
- Constant unbalance, under all conditions, indicates a wiring or load-balancing problem, not a momentary condition.
Matching timestamped power quality data to asset telemetry, such as drive fault logs or chiller trip logs, changes a meaningless waveform into an event you can diagnose rather than a puzzle to solve.
Troubleshooting and corrective measures (economics first)
Fix the cheapest, best-supported problem first, not the most dramatic-looking one.
- Use captured data to size the real remedy: harmonic filters, line reactors, surge-protective devices or even a load-scheduling adjustment.
- Consider the cost of downtime, lost production and equipment failure versus conditioning equipment before approving purchases.
- Notify the utility or a specialty consultant if the problem occurs before the meter.
- Re-monitor after repair. Short pre-fix surveys seldom confirm the cause by themselves. Jumping to solutions without validation may lead to purchasing a device for the wrong symptom.
Tips on filters and conditioners: measure the source impedance and prospective surge current path where the filter or conditioner will be installed, not just at the voltage waveform. Most corrective filters that have underperformed were sized from voltage readings only.
When repeating numbers continue to indicate aging switchgear or overloaded feeders instead of an identifiable fixable disturbance, that's your cue to advance the discussion around electrical system upgrades instead of continuing to add conditioning equipment on top of equipment that can no longer handle the load.
Impact of power quality problems on equipment and operations
Low power quality costs you money long before it appears on a fault report. Current with excessive harmonic content causes transformers and motors to operate at higher temperatures than their nameplate rating allows for, which reduces insulation life and increases the likelihood of an unexpected failure many years sooner than scheduled. Voltage sags that last only a few cycles can cause variable-speed drives, PLCs and contactors to trip, shutting down a production line that requires a time-consuming manual restart process.
Unbalance steals motor efficiency and bearing life without alarm, so a facility running unbalanced feeders for years might just be replacing motors frequently without realizing they're at the cause. Transients assail electronics cumulatively. Server PSUs, drive controllers and other sensitive instruments get damaged from repeated small jolts long before a single huge event takes them out, making troubleshooting afterwards unnecessarily nebulous.
From an operational standpoint, power quality problems put costs in a variety of pockets all at once: scrapped product from an interrupted process, overtime needed to restart equipment, early capital replacement and, in regulated industries, possible compliance exposure if the disturbance impacts safety or monitoring equipment. None of these expenses are tracked with an invoice labeled power quality, and that is precisely why so many facilities choose to under-invest in monitoring until some catastrophic failure forces the issue. Continuously monitoring power system reliability creates hard numbers out of that previously invisible expense; it can then be budgeted for and, most importantly, reduced.
Overview of power quality mitigation techniques
Treatment should be administered after identification, not before. After your monitoring identifies the real culprit, the toolbox divides into passive, active and procedural solutions.
Devices specifically designed to eliminate harmonics, such as passive tuned filters or active harmonic conditioners, address specific orders that have been identified in the spectrum and will decrease the distortion entering transformers and cables. Line reactors and isolation transformers mitigate the effects of switching transients and can reduce some harmonic content without adding the complexity of active filtering. Surge-protective devices (SPDs), which clamp transient overvoltages at the service entrance and or at point-of-use equipment, present another issue with respect to measuring transient levels. As discussed earlier, because of the clamping action of SPDs, monitoring equipment that looks only at voltage downstream of the SPD will underestimate the total transient activity present.
Voltage regulators and uninterruptible power supplies treat sags and interruptions directly and provide ride-through time for critical loads during brief utility events. Capacitor bank switching schemes and correctly tuned power factor correction reduce drawn reactive power, but must first be evaluated with harmonic data in hand. Poorly tuned capacitors are one of the most common sources of the resonance spikes mentioned previously; they are not a solution to them.
Procedure fixes are equally important as hardware changes. Offset large motor starts, move sensitive devices away from known offending locations and even just balance loads across phases can fix problems that may have otherwise required costly conditioning devices. The appropriate mitigation is whatever the monitoring proves necessary, not what you suspected beforehand.
Comparison of portable versus permanent monitoring solutions
Portable analysers have advantages in flexibility and price. One instrument can sample a suspect panel this week and another next month, so when it comes to diagnostics, one-off complaints and pre-purchase diligence on a new site the portable solution is usually the most practical option. The drawback is scope: a portable only monitors what it's plugged into, for as long as it's plugged in, which is exactly why NIST warns you about them if disturbances are seasonal or otherwise infrequent.
Permanent monitoring justifies its higher initial cost where there is genuine downside to missing an event on critical loads. Data centres, hospitals or continuous process manufacturing lines are good examples of places that benefit from meters permanently connected to switchgear, with alarms and trending integrated into a building management system 24/7. The downside is, of course, the expense: permanent meters on every panel in a large facility cost money, and most facilities choose to monitor only critical loads.
A compromise employs both. Install permanent meters on the few feeders where an outage is very costly, and use portable units everywhere else on an as-required basis. The correlation of that data over time provides more benefit to long-term power system reliability than either method by itself. Plus, it prevents you from buying continuous monitoring equipment everywhere just because you can, instead of where it's needed.
PODTECH perspective: integrating PQ telemetry into wider operational monitoring
Power quality data isn't very useful by itself in a spreadsheet. When correlated to asset telemetry, chiller cycles, UPS load, drive fault logs, it goes from being a diagnostic curiosity to an early input into predictive maintenance. A harmonic creeping up months before a transformer fails is far more useful information than knowing the failure occurred.
Open formats play a role here too. PQDIF, API-accessible telemetry allows PQ data to become inputs to machine learning models along with environmental data and asset telemetry, instead of remaining stagnant inside a proprietary PQ viewer application. POD View was architected on the same idea, ingesting correlated telemetry into a single layer of analytics instead of leaving engineers to manually correlate between point solutions. The DCIM integration work our team at PODTECH has completed follows the same ethos applied to larger infrastructure monitoring use cases: multiple sources of data, unified view of operations.
— Harry
How PODTECH can help
Power quality information is only as good as the system that it powers. For many facilities struggling with multiple solutions for electrical monitoring, BMS alarms and asset telemetry data, PODTECH provides the integration layer to end that siloed approach: our datacentre telemetry, DCIM consultancy and BMS or Property Management System integration services are designed to aggregate power quality data into the same place as the rest of your critical facility infrastructure.
In other words, comparing a harmonic trend to a chiller fault log or inputting permanent meter data into predictive maintenance algorithms without having to roll your own plumbing. If you've got a site requiring power quality telemetry integrated with an enterprise-wide monitoring platform, contact PODTECH about surveying an integration or building custom analytics.
Sources
FAQ
What Is a Power Quality Monitor?
Power quality monitors are instruments that measure voltage, current, and other electrical quantities and capture data for analysis to identify anomalies such as sags, harmonics, and transients. Monitors range from portable recorders that can be temporarily connected to power system components for diagnostic monitoring surveys to permanently installed meters connected into switchgear for continuous real-time monitoring. IEC 61000-4-30 Class A represents the highest quality of measurement accuracy.
Can I Rent a Power Quality Analyser?
Portable analysers are normally rented rather than purchased outright. They are used for short-term diagnostic surveys, rather than permanently installed on the grid. This might cover the bases of a one-off troubleshooting job, or a pre-purchase site survey. Renting makes sense if the disturbance is understood and localised; however a facility with continuous risk on critical loads would typically justify installing a permanent meter.
What Is the Best Power Quality Monitor for a Small Site?
There is no ideal instrument. If you are troubleshooting a known issue, then a portable recorder or bench analyzer makes sense. However, if you need to continuously protect a critical load, you need a permanent Class A meter on that feeder. Choose your instrument based on your exposure, not on purchasing the most capable device.
Is Whole Site Power Monitoring Worth the Cost?
On critical feeders feeding facilities such as continuous processes, data centres or other sensitive electronic equipment, continuous monitoring will generally pay for itself through identification of deteriorating conditions such as a developing harmonic distortion trend prior to failure. On smaller or less critical feeders, an economical combination is often periodic portable surveys with monitoring on the most critical panels.
How Long Should a Power Quality Survey Run?
Days can prove a repeatable known problem. Weeks can capture typical variation of load by day of week, shift and equipment cycles. And according to NIST, extreme events can be seasonal or occur only once every few years. Therefore if you survey for only a few days, you may not capture the exact event you're looking for. This is why follow-up validation of a fix is important.