PODVIEW
Datacenter Monitoring
Operational intelligence for power, cooling, environment and infrastructure health. One site or a portfolio, on open protocols, in one place. Built and supported in the UK.
Thousands
Monitoring Points
Per deployment
<1s
Alert Latency
Real-time response
24/7
Managed Service
Break-fix SLA
100%
Open Protocol
Modbus, SNMP, MQTT, and more
The Challenge
Monitoring has not kept pace with what is being installed. Rack densities have climbed, estates have spread across more sites, and the systems watching them are still a set of vendor consoles that do not talk to each other. Somebody ends up reading four screens to answer one question.
Liquid cooling is where that gap bites hardest at the moment, so it is worth setting out in full. It is the sharpest current case, not the only one PODVIEW is built for.
Thermal Complexity
CDUs with dual plate exchangers, variable-speed pumps, primary and secondary circuits — each with unique temperature, pressure, and flow characteristics.
Demarcation Ambiguity
Where does landlord responsibility end and tenant responsibility begin? The CDU is the interface — half belongs to each party. Clear monitoring boundaries are essential.
Resilience & SLA
N+2 pump configurations, automatic failover on anomaly detection, and contractual SLAs that span both landlord and tenant — all require intelligent monitoring.
What It Watches
Six domains, one normalised data model. Points arrive from whatever is already installed — BMS, PDUs, CDUs, panels, sensors — and land in the same place with the same units and the same timestamps.
Environmental
- Inlet and outlet temperature
- Relative humidity and dew point
- Differential pressure
- External ambient conditions
Power
- PDU and per-outlet metering
- UPS state and remaining autonomy
- Breaker trip and rectifier fail
- PUE
Cooling
- CDU primary and secondary circuits
- Flow and pressure
- Plate exchanger delta-T
- Pump status and failover
Access
- Door switch and smart lock state
- Unauthorised access events
- CCTV integration
- Cabinet intrusion
Fire & Leak
- Smoke and fire detection
- Per-rack leak detection
- Automatic valve isolation
- Shunt trip on detection
IT Infrastructure
- Device reachability
- SNMP hardware health
- Network termination state
- Link status
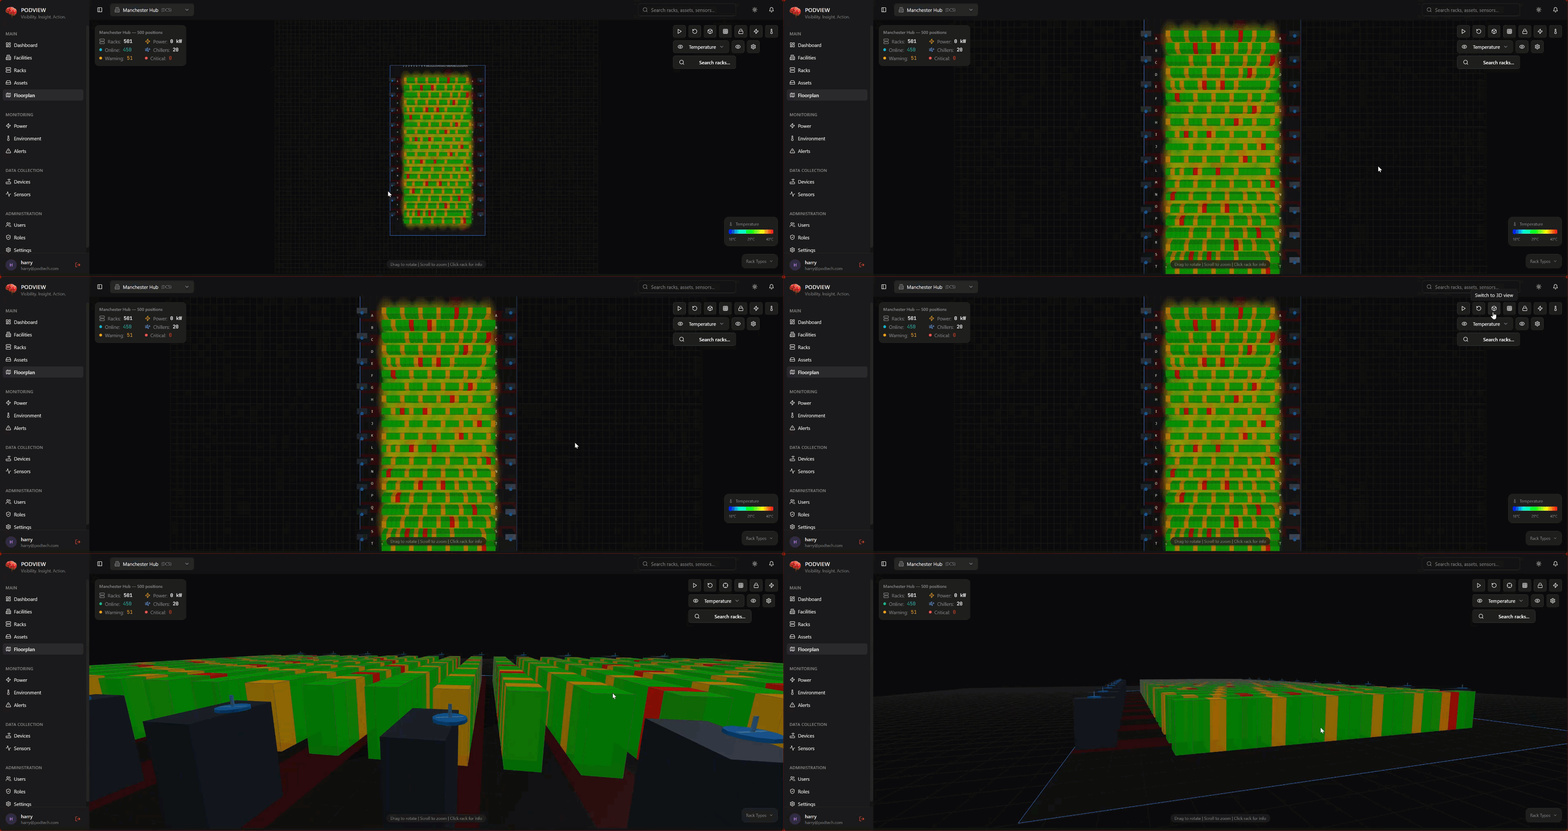
Immersive Data Hall View
Walk the hall without walking the hall. Racks are heat-mapped from live inlet readings, CDUs are colour-coded by state, and any object can be clicked to open its underlying telemetry. It is the fastest way to answer where rather than what.
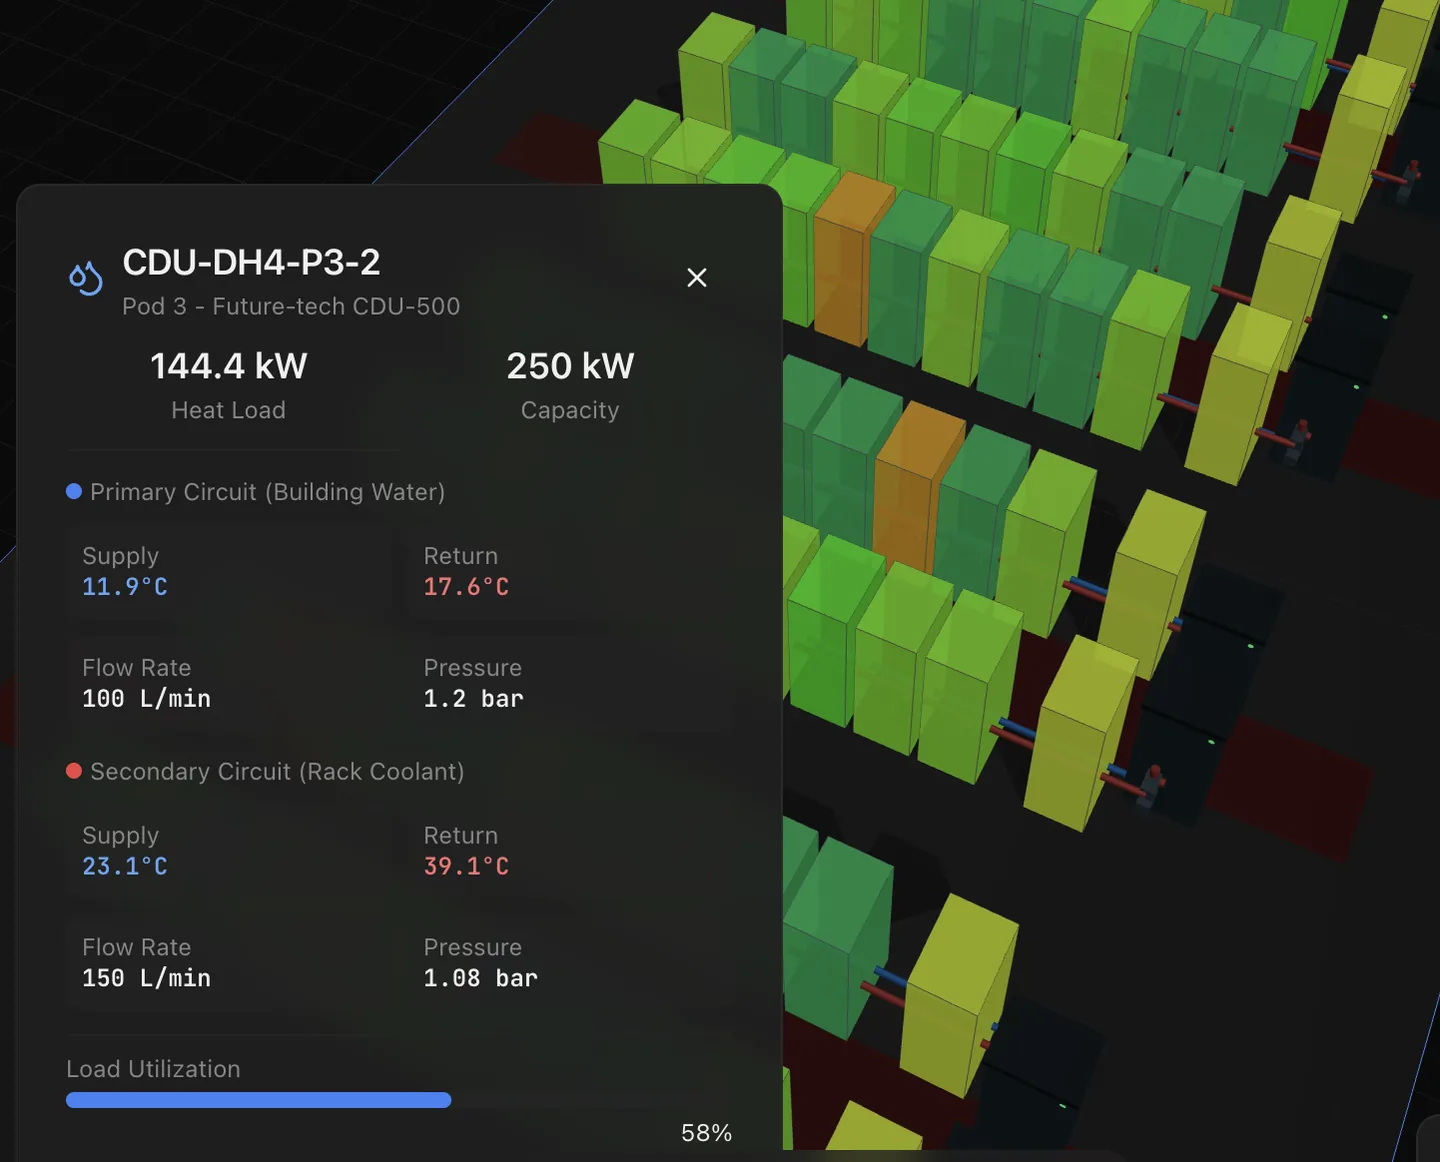
Complete Circuit Visibility
Every Coolant Distribution Unit monitored in real time — primary building water circuit and secondary rack coolant circuit, with full sensor telemetry at your fingertips.
Primary Circuit (Building Water)
Secondary Circuit (Rack Coolant)
CDU Internals
Platform Capabilities
The everyday work of running a facility: watching it, being told when something moves, and being able to prove afterwards what happened.
Real-Time Monitoring
Temperature, pressure, flow rate, and humidity across thousands of monitoring points. Sub-second data refresh with configurable polling intervals.
Intelligent Alerting
Threshold-based and anomaly-detected alarms. Automated ticket generation with severity classification — critical, warning, and informational.
Leak Detection
Per-rack leak detection probes with automatic isolation — water valves close and shunt trips kill power to prevent chip overheating. Panel turns red on detection.
Pump Failover Logic
N+2 pump resilience monitoring. Automatic detection of out-of-range states (pressure, flow, temperature) with failover to secondary pump — zero downtime.
Power & PUE Analytics
Track total power, IT load, cooling load, and PUE across facilities. Time-series trending with per-facility and per-rack breakdowns.
Open Protocols
Modbus, BACnet, SNMP and MQTT through POD-A1. Run standalone or present as a subsystem on the existing BMS — the data model is the same either way.
Asset Management
Full inventory of CDUs, racks, sensors, valves, and pipework. Serial numbers, positions, maintenance history, and warranty tracking.
Multi-Site Portfolio
Manage London, Paris, and beyond from one platform. Regional views with facility-level drill-down and cross-site comparison.
Managed Break-Fix
SLA-backed on-site engineering response. Automated dispatch, issue tracking, and resolution reporting — the tenant never has to touch the secondary loop.

Power & Efficiency at a Glance
Track total power consumption, IT load vs cooling load, and PUE in real time. Identify inefficiencies across facilities and optimise cooling energy spend.
- Total power, IT load, and cooling load breakdown
- PUE tracking with trend analysis
- Per-facility power distribution
- Tap-off telemetry and bus-bar monitoring
- 24-hour, 7-day, and 30-day time-series views
System Architecture
Four layers. Field devices are read where they sit, POD-A1 normalises them on site, PODVIEW stores and presents the result, and anything downstream takes a feed.
Field Layer
Sensors, PDUs, CDUs, BMS, panels
POD-A1
Appliance or VM on site — ingest, normalise, buffer
PODVIEW
UK-hosted cloud, or hybrid with an edge buffer
Consumers
Web and mobile, BMS, ITSM, NMS, API
Unmanned sites can be given an out-of-band SIM, so the link back does not depend on the building's own network being up. On a liquid-cooled floor the same architecture puts PODVIEW at the demarcation point between landlord and tenant, with no BMS credentials required.
Standalone Deployment
Operates independently with its own sensor network and control logic. Break-fix engineers access a dedicated portal — no BMS credentials required.
BMS Integration
Connects via Modbus marshalling box to appear as a subsystem on the main BMS. Full data mirroring or critical-alarm-only — configurable per client.
Proactive, Not Reactive
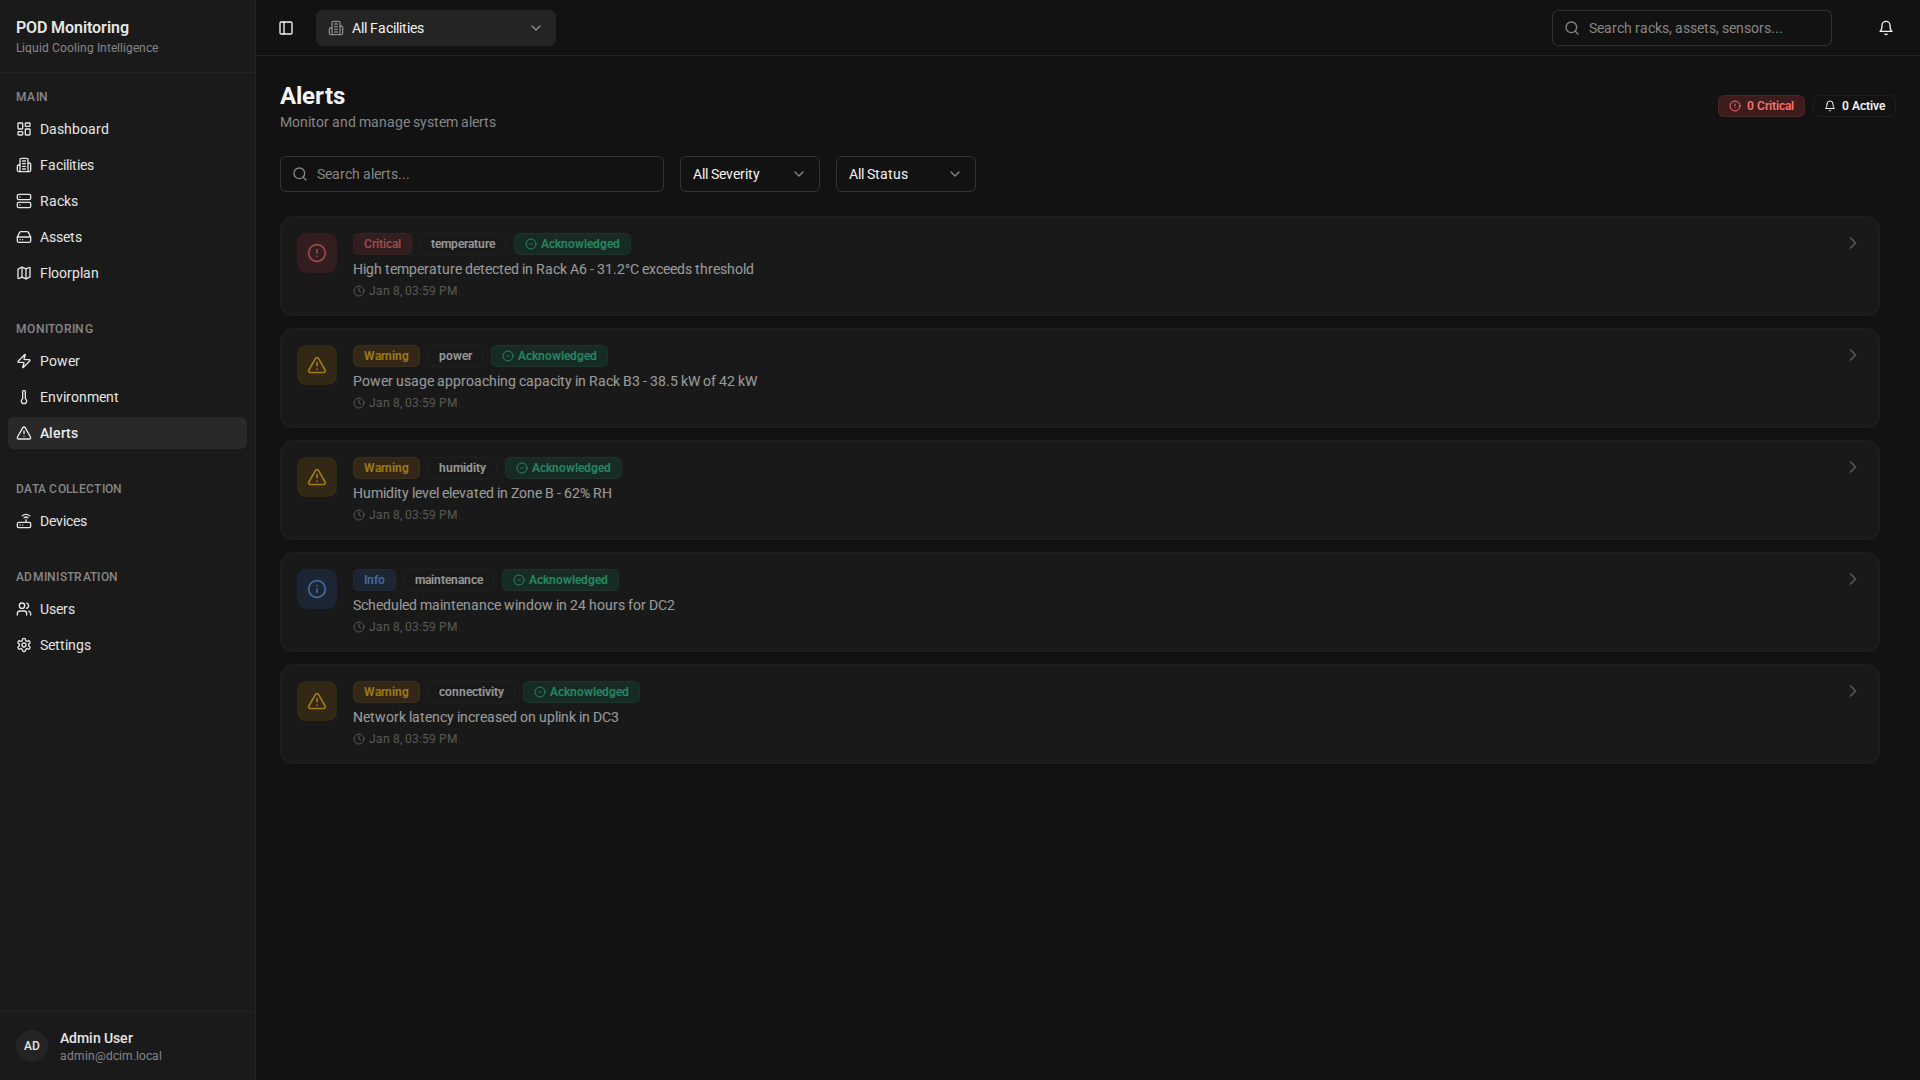
Every alert is classified, tracked and routed. A high inlet temperature and a leak event do not deserve the same treatment, so they do not get it — severity drives who is told and how quickly.
Leak detected — rack isolated, shunt trip activated
CDU pressure approaching capacity threshold
Scheduled pump rotation completed successfully
Where alerts go
Multiple recipients per site, so the site team, the NOC and the on-call engineer can each get the subset that concerns them.
Records You Can Hand to Someone Else
Most reporting requests arrive after the event, from a client, an auditor or a landlord. Everything PODVIEW holds can be exported without asking us to run a query for you.
Exports
- CSV for analysis
- PDF for circulation
- Excel for finance and reporting packs
- Scheduled or on demand
Asset Register
- Serial numbers and positions
- Warranty status
- Maintenance history against each asset
- Sensors, CDUs, PDUs and pipework
Energy & Data Access
- Total power, IT load and cooling load
- PUE with trend analysis
- Per-facility and per-rack breakdowns
- REST API for the raw time-series
Platform Controls
These are the controls in the product. Your security team will want to review them before anything is connected, so they are listed plainly rather than as badges.
HTTPS with TLS 1.2 or later
All traffic between browser, API and platform.
Encryption at rest
Stored telemetry and configuration are encrypted on disk.
Role-based access control
Permissions scoped by site, by hall and by function.
Multi-factor authentication
Available on all accounts, enforceable per tenant.
Audit log
Who changed what, when, and from where.
Scoped API keys
Keys limited to the endpoints and sites they need.
Syslog to your SIEM
Platform events forwarded to the tooling you already run.
UK hosting
Data held in the UK, or on your own infrastructure in a hybrid deployment.
Built For
Colocation Providers
Sell monitoring to tenants as a managed service, with a clear demarcation line and an SLA behind it. Per-tenant views without exposing the rest of the floor.
Multi-Site Operators
Hundreds or thousands of points across halls and sites, in one portfolio view. Regional roll-ups with drill-down to a single rack when you need it.
Mechanical Contractors
Commission and maintain plant with the data in front of you rather than in a logbook. Asset tracking, history against each unit, and dispatch when something fails.
See It Against Your Own Site
Book a demonstration and bring your point list. It is a far more useful half hour than a generic tour, and it tells you quickly whether what you already have will connect.