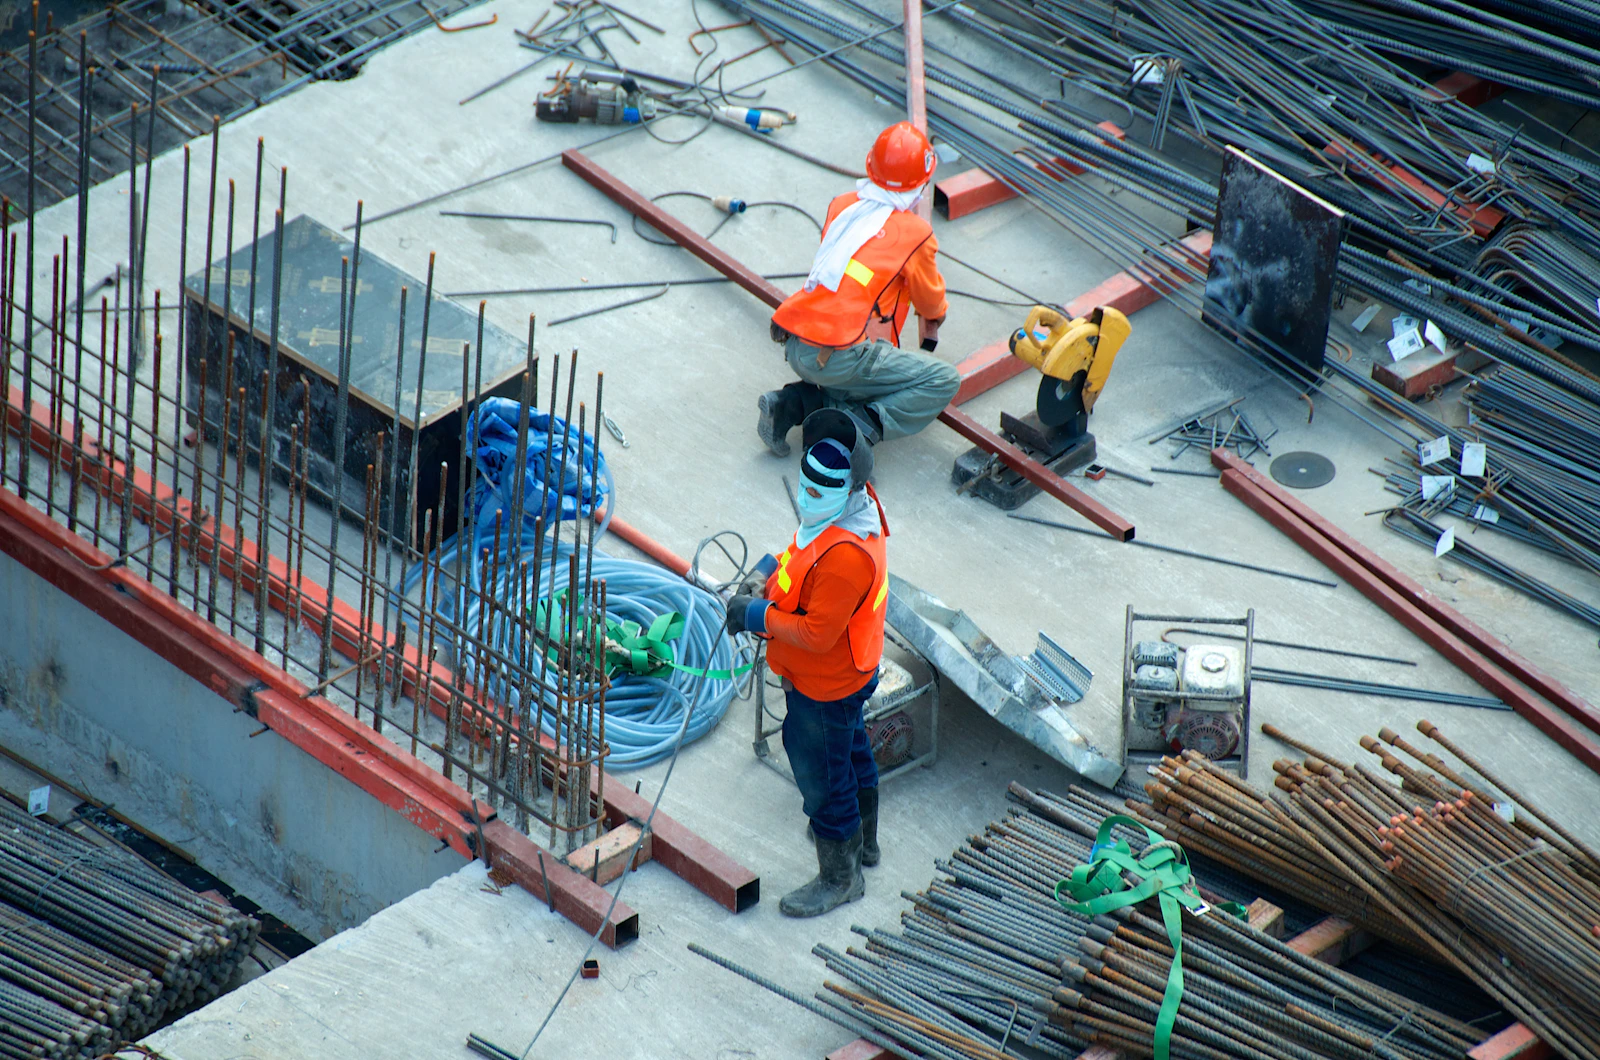
Construction safety analytics turns video, sensor and inspection data into actionable early warnings so you can respond before an incident occurs. It moves your focus from lagging injuries to leading indicators that pinpoint where risk is developing. Backed by strong governance and worker buy-in, it provides a quantifiable method for prioritising interventions to improve safety performance.
TL;DR:
- Start with two or three quantitative goals, such as inspection coverage or hazard closure time, and clean messy data before modeling.
- Assign every alert to an action-taking authority, then connect detections to the tools your teams already use. Alerts sitting in a standalone portal will be ignored.
- Fuse video with inspection and sensor data where possible; models trained mostly on camera data may not generalize well across sites and conditions.
- Protect individual employee information with transparent notice, consent, access and retention policies, and keep human oversight over decisions in dynamic site conditions.
- Expect unsafe observations to rise after launch if detection improves; evaluate trends over months and compare response times before concluding safety worsened.
PODTECH
Build Construction Safety Software Tailored for Your Worksite
PODTECH is a provider of custom software, artificial intelligence and machine learning technology for construction safety and smart building analytics.
Learn More About PODTECHTable of Contents
- What is construction safety analytics and why does it matter to you?
- Which on-site use cases are ready to deploy today?
- Which data should you capture, and how do you choose leading indicators?
- How do computer vision, classical ML and temporal models differ?
- What does a practical implementation checklist look like?
- Which KPIs show whether analytics is improving safety?
- What does the research say about predictive safety analytics?
- What barriers should you expect, and how do you reduce them?
- What separates pilots that fail from those that deliver?
- How can we help you build safety analytics that works on site?
- FAQ
- Sources
What is construction safety analytics and why does it matter to you?
Construction safety analytics involves gathering data from the jobsite and analysing it to identify hazards, prioritize risk and enable response. It sits on a ladder of several steps. Monitoring merely captures activity: camera feeds, inspection reports, sensor data. Descriptive analytics summarize what's happening, such as unsafe observations by trade and zone. Predictive analytics takes it a step further by forecasting where the next incident is likely to occur so you can deploy a supervisor there in advance.
Lots of teams don't do prescriptive reporting. Monthly incident reports tell you what went wrong. They don't prescribe what to look at tomorrow.
That is where the leading vs. lagging terminology comes into play. OSHA and NIOSH even suggest trying to balance your lagging indicators with leading indicators. Leading indicators are actions you took before the incident happened that could have prevented it. They are a sign you have a problem before it's too late to do something about it. When leading indicators go up, lagging results should go down.
For project leaders, the practical gains are concrete:
- Inspections go where the risk is, rather than following a fixed round.
- Hazard reports get faster responses because alerts reach the right person.
- Resources are allocated on risk, from supervisors to temporary protection, instead of habit.
Our research is documented in our guide to AI applications in construction safety, which you might find useful. If you need to share background with a broader team, our introduction to what construction safety technology is will help you align on terminology.
Which on-site use cases are ready to deploy today?
Multiple families of use case are developed enough to test pilots. Each of these solves a discrete, repeatable safety issue.
Video analytics. Cameras already on site can be analysed continuously for:
- Fall-risk situations, such as workers near unprotected edges or openings.
- PPE verification, including hard hats, high-visibility clothing and eye protection.
- Intrusion alerts when someone enters a restricted zone.
- Vehicle and pedestrian conflict detection around plant, deliveries and reversing equipment.
Wearable sensors. Sensors worn by the worker can identify fatigue behaviors, provide proximity alerts to moving plant and monitor ergonomic stressors like repeated awkward lifting. They are appropriate for work locations where cameras may have trouble seeing, such as inside equipment or at night.
Drones and digital twins. With frequent aerial mapping you can map hazards across extensive sites, map access routes to help create safer sites and link risk assessments to progress on construction. As the twin updates to show a new floor being constructed, the related risks can be updated accordingly.
Inspection and observation programmes. Job safety analyses, checklists and observation cards aren't pointless paperwork. They're some of the best inputs into a predictive model. Research with actual practitioners using predictive analytics has shown that when inspection and observation data is structured properly it can lead to highly accurate predictions of incidents. It also shows that structured inspection programmes with high volumes of inspections have lower incident rates.
A crane lift job safety analysis, for example, documents the task, hazards and controls. Recorded electronically with time, location and crew data attached, it becomes a single data point for a model to compare against other lifts.
This is where all of these use cases converge: real-time response. A PPE miss detected by a camera can send an alert to a supervisor's phone in seconds. A proximity alert can trigger in a worker's headset. A restricted-zone entry can freeze a crane operation until the zone is clear. This sort of value is realized when the alert goes to someone who has the power to take action. That's why you need to know who gets which alert before you turn anything on.
Which data should you capture, and how do you choose leading indicators?
Begin with the indicator and trace back to the data. Make sure that your leading indicator is something that connects to what you care about and can be influenced by someone.
Common leading indicators are things like inspection counts, unsafe observations frequency, and hours from hazard discovery to hazard closure. Recordable incidents are lagging indicators that still matter, but are too late to influence daily choices.
Quality over quantity. NIOSH practitioner research found that leading indicators were most effective when tracking efficacy versus activity. Hours of training completed only tells part of the story. A retention quiz at the end of training speaks volumes.
The data types worth capturing are:
- Time-stamped inspection and observation logs.
- Labelled video frames, where people have tagged what the camera should recognise.
- Wearable telemetry such as movement, heart rate or location pings.
- Equipment telematics from plant and vehicles.
- Environmental sensor readings, including noise, dust, heat and wind.
Predictive models are only as good as the consistency of what you input. Here are several game changing habits:
- Use the same checklist wording across sites, so “unsafe observation” means one thing.
- Synchronise timestamps between devices so an alert from a camera can match one from a wearable at the same moment in time.
- Geo-tag records to a zone or level, not just a project.
- Store role metadata such as trade and shift so patterns can be explained, not just detected.
Tell the truth about holes. If a facility has spotty inspection logs, pilots should start by cleaning up the record, since a model is only going to emit noisy alerts if it's fed noisy inputs.
How do computer vision, classical ML and temporal models differ?
Every family of technique works best with certain types of data. Knowing what types suit which helps you debunk a vendor's claims.
Computer vision is used to detect objects and locations in images and video. YOLO and CNN-style models have been used extensively for PPE detection, as well as determining the locations of humans and machines in relation to one another. A 2025 systematic review of AI for occupational risk assessment found computer vision using cameras was the most used method in construction research, and noted that YOLO and CNN models have been used extensively for PPE detection.
Tree-based and ensemble models such as Random Forest perform quite well on tabular data, for example inspection scores, type of task, weather, headcount and trade mix. They are also comparatively explainable, as you can see which variables affected a prediction, allowing you to explain a decision to a site manager.
Sequence models, think LSTM networks, observe how measurements vary over time. They are appropriate for early-warning type problems where the trend is more important than an absolute value: increasing fatigue scores throughout a shift, or a gradual uptick of near misses on one floor.
None of them is inherently superior to the others. Pick whichever is appropriate for the data's distribution and supports your decision.
The review that also established camera dominance notes a caveat though: it calls out a requirement for multimodal data and for interpretable models. One way to give a model multiple independent views of the same situation is with a multimodal pipeline fused with video, sensor and inspection data. A camera can see a worker without a harness near an unprotected edge. The inspection log may indicate that edge protection was logged as incomplete the previous day. The wearable may show how long that worker has been active without a break. Together these facts tell a far stronger story than any could alone, and they can reduce the false alarms that destroy trust onsite.
What does a practical implementation checklist look like?
Consider the initial launch a pilot rather than a rollout. The following will help ensure it stays scoped and practical.
- Identify two or three quantifiable goals associated with leading indicators, for example inspection coverage or close-out time on hazards. Define which zones and trades are included in the pilot.
- Construct the data pipeline: ingestion from cameras, sensors and inspection apps, labelling of training data, storage, anonymisation where people are identifiable, and audit logs showing who viewed or accessed what.
- Decide where processing takes place. Processing can happen on the edge near the camera, reducing latency and bandwidth use. Cloud processing is easier to scale and update. Most sites use a hybrid edge/cloud model.
- Plan hardware and connectivity. Select ruggedised cameras and sensors where appropriate, and plan signal coverage before any hardware is fitted.
- Fit the system into workflow: automatic alerts, assigned inspections, supervisor dashboards and brief training for alert recipients.
- Implement governance: privacy policy, worker consent and notice, model monitoring, and a model retraining schedule.
Tips. Tell stakeholders what they need to know, and not more. Share only what they need to act on. For example, foremen see live alerts for their area or zone. Project managers watch trends. Executives see leading and lagging KPIs together on one screen.
Integration is worth special consideration. Standalone analytics portals are a bad fit for real operations. Hook them up to whatever tools your teams are already using every day, whether that is your construction management software, your document control system or your enterprise reporting tool. A lot of what we do at PODTECH sits in this layer: systems integration that ensures a detection becomes an assigned task. You can see what that looks like implemented in our LifeSafety.ai case study.
Don't forget about compliance. Video and wearable data that includes identifiable employees is considered personal data in many regions. Ensure your retention, access and consent plans are vetted through your legal and data protection teams prior to launch, as needs will differ by region and industry.
Which KPIs show whether analytics is improving safety?
Take metrics on three tiers, allowing you to know if safety is increasing and if your analytics are healthy as well.
Leading KPIs show whether prevention activity is working:
- Inspection coverage across zones and trades.
- Unsafe observation rate relative to hours worked.
- Average response time to hazard reports.
Lagging KPIs shouldn't be left off the dashboard either. After all, they tell you whether your prevention efforts are working:
- Recordable incident rate.
- Lost-time incident frequency.
Model and operational KPIs tell you whether the system deserves trust:
- False positive rate: too many wrong alerts and people stop reacting.
- Model latency: how long between an event and the alert.
- Sensor uptime and data completeness.
Report it differently to different audiences. The site foreman wants live, zone-level alarms. The project director wants a weekly trend with some context. Senior leadership wants a handful of headline metrics that tie analytics to incident performance. If you give everyone a detailed dashboard they all dive into, you guarantee nobody will read it.
Beware of a tempting pitfall: often unsafe sightings will increase after you roll out analytics. This is generally good, as you are now aware of what was already happening. Consider the trend for a few months in conjunction with response times before judging.
What does the research say about predictive safety analytics?
The research base is substantial but uneven, and it is worth knowing both halves.
On the positive side, a 2025 systematic review on predictive risk modelling states that visual data and models like YOLO and CNN lead construction safety research while others have applied methods like Random Forest and LSTM. Independently, Predictive Solutions research showed that structured inspection and observation data can accurately predict incidents when enough standardised data is available.
The limitations are equally important. A 20/26 systematic review published in the Journal of Public Health cautioned safety leaders to own the entire AI lifecycle to mitigate algorithmic bias and over-trust, and reminded us that AI won't solve everything. Specifically, AI can't replace complicated decision-making processes of humans on dynamic construction sites. The visual-data review also said too much dependence on cameras hurts generalisability, which is why multimodal datasets matter.
As a heads up for your lesson planning, this lesson works: predictive analytics is trustworthy when you have organized data and lots of it. It fails when you expect a model trained on one site to work perfectly on another.
What barriers should you expect, and how do you reduce them?
Most failed deployments stumble on people and process rather than algorithms. Four obstacles recur.
Data shifts and label gaps. If you train a model on summertime images of a steel frame construction site, it might misinterpret concrete being poured in the winter. The trustworthy-AI lifecycle framework defines stages from planning and data collection through deployment to maintenance, archiving and lifecycle monitoring. Applied to sites, that means holdout validation on a separate worksite, continuously tracking accuracy and scheduling re-training when conditions change, such as a new phase, plant or lighting condition.
Trust and privacy. Research published in 2025 identified privacy, lack of standardised oversight and worker trust as the top three inhibitors to wider adoption of digital surveillance. The paper recommends shifting towards a data culture built on trust, where workers feel confident understanding why monitoring is taking place and what safeguards are in place to protect their data. Publish your policy, anonymise footage where possible, and communicate with crews about how you will roll it out.
Hardware ruggedness. Dust, vibration, rain and power outages will quickly expose weak hardware. Specify rugged units, schedule maintenance and lock down the connections.
Become part of your culture. Analytics work best when they're sponsored by leadership, training programs are quick and hands-on, and checks become habit instead of something you do in addition to work.
What separates pilots that fail from those that deliver?
In my experience of this space, the void has almost never been the standard operating procedure. Instead it has been that nobody had ownership over the entire chain: sensor to supervisor action. Someone with a great detector but no validated response process creates alerts that no one reads. Someone with great dashboards but brittle sensors creates gaps that undermine trust.
Joined-up delivery starts with clear goals up front. Build-to-operate engineering should be designed for reality, on an actual site, not in a bubble, and operations should be brought into the project at week 1 instead of being shown the finished product at week 52. Measure technical performance, was the model prediction right, and adoption, are inspections being completed and what percentage of alerts receive a follow-up. A perfectly accurate model that nobody uses does not help anyone.
Seek demonstrated integration experience, discipline across the ML lifecycle, and real safety domain knowledge when selecting a delivery partner. Be wary of any sales pitch that positions the three as optional silos.
— Harry
How can we help you build safety analytics that works on site?
We develop tailored machine learning, telemetry and systems integration for organisations who require safety analytics that work reliably on actual jobsites. Projects range from custom machine learning development, the integration layer required to connect detections to your current tools, to our productised solutions such as LifeSafety.ai and SiteChief.
A sensible way to begin with us:
- A readiness review of your current data, cameras and inspection process.
- A scoped pilot tied to the leading indicators that matter on your projects.
- A proof-of-value engagement that tests the approach before you commit to scale.
If you would like to discuss piloting, please contact us with a brief description of your site, your data and the risks you would most like to detect early.
FAQ
What is the 20-20-20 rule in construction safety?
The 20-20-20 rule is commonly defined as a vision-resting exercise to take during computer work. There is no official construction safety standard for this rule. Please refer to your site-specific policy and OSHA standards for specific requirements.
What are the most common safety metrics used in construction?
Teams most often track lagging indicators like recordable incident rate and lost-time incident frequency. These provide important feedback on performance and drive improvement. Leading indicators such as inspection coverage, unsafe observations and hazard correction rates can be tracked as well. OSHA and NIOSH provide guidance that recommends teams track both.
How is data analytics used in construction safety?
It converts inspection data, video feeds and sensor readings into actionable alerts and risk scores. According to a 2025 systematic review, computer vision is the most studied technology in construction research.
Can you provide examples of job safety analysis in construction?
Examples include a crane lift, excavation of a trench, working at height on scaffolding and hot work like welding. Each Job Safety Analysis lists task steps, hazards at each step and the controls. This information is digitally captured with time stamps and location and can be used in predictive models.
Sources
This article titled "Artificial intelligence and occupational health and safety: a systematic review" was published in the Journal of Public Health.
This paper presents a systematic review and mapping of scientific literature on Artificial Intelligence (AI) and Machine Learning (ML) developments as applied to the prevention of occupational risk. The main goal of this review is to collate and summarize available scientific evidence regarding predictive risk modeling and prevention strategies in the workplace, utilizing AI and ML technologies.
Achieving On-site Trustworthy AI Implementation in Construction Industry Across AI Lifecycle Lifecycle Framework [PDF]. (2022). MDPI. https://www.mdpi.com/20 75-5309/15/1/21