
Data-driven decision making (DDDM) is the business process of using data and analysis to guide decisions rather than relying on intuition alone. For enterprise decision-makers, that distinction is consequential: organisations that replace gut instinct with structured evidence reduce uncertainty, align resources to measurable goals, and act with greater speed and confidence.
This guide delivers:
- A clear definition and the core components of DDDM
- An implementation process with a practical checklist
- Key KPIs to measure programme health
- Common pitfalls, including UK GDPR considerations
- Tools relevant to the UK market such as Tableau and IBM Analytics
- A first-actions checklist you can use this week
Table of Contents
- What data-driven decision making actually means
- Why DDDM matters: the business case in plain terms
- How to implement DDDM: a six-step process
- Building a data-driven culture: what leaders must actually do
- Common pitfalls and how to avoid them
- What to measure: KPIs that show your programme is working
- Which tools and platforms should you consider?
- Where DDDM adds clear value: practical use cases
- PODTECH’s practitioner perspective on DDDM in mission-critical systems
- Realistic timelines and the cost drivers you need to plan for
- Your first actions: a checklist to start this week
- Key takeaways
- The gap between data ambition and data reality
- PODTECH brings data-driven decisions to mission-critical infrastructure
- Useful sources and further reading
What data-driven decision making actually means
DDDM is not simply “using data.” It is a structured discipline with defined components that work together. Understanding each one is what separates organisations that extract value from those that collect data and do nothing with it.
The core components:
- Objectives: A clearly stated business question or goal that the analysis must answer. Without this, data collection becomes unfocused and expensive.
- Data sources: Transactional records, behavioural logs, telemetry streams, survey responses, and external market data. The mix depends on the decision type.
- Data collection: The third step in the standard framework, and the one most organisations underestimate. Poor collection methods corrupt every downstream step.
- Analysis: Statistical modelling, visualisation, and machine learning applied to surface patterns and test hypotheses.
- Decision: The informed choice made by a human, supported by the analysis. Data informs; people decide.
- Action and sharing: Executing the decision and communicating insights to stakeholders so the organisation learns collectively.
The roles involved span data engineers (who build and maintain pipelines), analysts (who interpret outputs), and business owners (who own the decision and its consequences). Each role is distinct. Conflating them can cause friction in early-stage programmes.
Why DDDM matters: the business case in plain terms
The primary benefit is reduced uncertainty. When decisions are grounded in evidence, the range of plausible outcomes narrows. That matters most in high-stakes environments where a wrong call carries significant cost.
Predictive analytics can surface patterns such as customer churn or operational bottlenecks before they become systemic problems, converting reactive firefighting into pre-emptive management. A retailer spotting a churn signal three months early has time to intervene; one that notices only after revenue drops does not.
Primary business benefits:
- Reduced uncertainty: Evidence replaces assumption, narrowing the range of likely outcomes.
- Faster decisions: Agreed metrics and dashboards cut the time spent debating what the numbers say.
- Goal alignment: Decisions trace back to defined objectives, keeping teams pointed in the same direction.
- Efficiency gains: Combining quantitative and qualitative data reduces waste in areas like inventory, staffing, and marketing spend.
- Predictive capability: Machine learning models identify future risk and opportunity, not just past performance.
A practical illustration: a construction firm using sensor data and AI to monitor site conditions can identify safety risks before incidents occur, as demonstrated in PODTECH’s SiteChief.com case study. The data does not replace the site manager’s judgement; it gives that judgement a factual foundation.

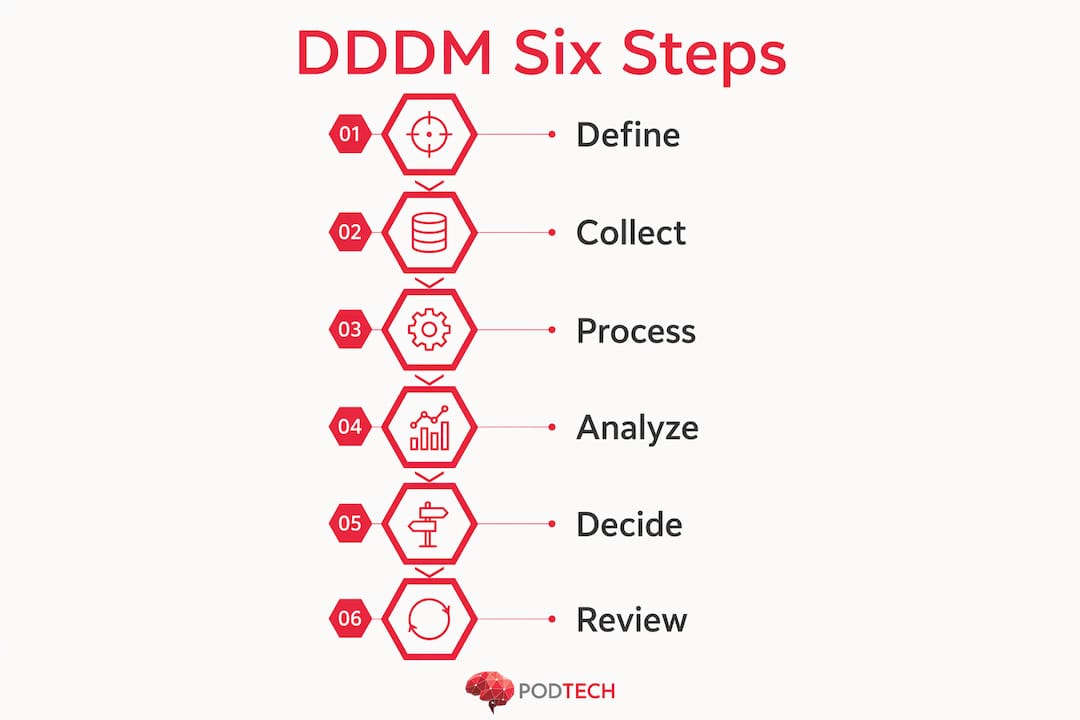
How to implement DDDM: a six-step process
The standard DDDM framework runs in several sequential steps. Skipping steps, particularly steps two and three, is the most common reason implementations stall.
- Identify objectives. Define the specific business question. “Improve performance” is not an objective. “Reduce unplanned downtime in Facility A by 15% within six months” is.
- Identify relevant data sources. Map existing internal sources (ERP, CRM, telemetry, logs) and assess gaps. Determine whether external data is needed.
- Collect the data. Build or configure pipelines to extract, load, and transform data reliably. Establish data quality checks at ingestion.
- Analyse to uncover meaning. Apply statistical analysis, visualisation, and modelling. Test hypotheses. Document assumptions.
- Make the informed decision. Present findings to decision-makers with clear narrative context, not just charts. The analysis supports the decision; it does not make it automatically.
- Act on and share insights. Execute the decision, communicate outcomes to stakeholders, and set a review date to assess impact.
Implementation checklist for programme leads:
- [ ] Business objective documented and signed off by a sponsor
- [ ] Data sources inventoried and access confirmed
- [ ] Data quality baseline measured before analysis begins
- [ ] Analysis approach peer-reviewed before findings are presented
- [ ] Decision rationale recorded alongside the data that supported it
- [ ] Review date set and KPIs agreed in advance
Pro Tip: Start with one decision, not an enterprise-wide transformation. Pick a question with a clear answer, a short feedback loop, and data you already have. Document the process. That single pilot builds the credibility and the muscle memory the wider programme will need.
Building a data-driven culture: what leaders must actually do
Becoming data-driven is more about culture than technology. Organisations that succeed give people self-service access to data, invest in literacy, and treat data as an enterprise asset rather than an IT resource. Those that buy expensive platforms without addressing behaviour change rarely see the return they expected.
Practical steps for leaders:
- Secure executive sponsorship. A data programme without a senior champion loses budget and priority at the first obstacle.
- Invest in data literacy. Train teams to read, question, and communicate data. The UK’s Digital Skills Partnership and providers such as Coursera offer structured programmes.
- Enable self-service analytics. Give business users access to pre-built dashboards and governed data sets so they do not depend on analysts for every query.
- Document decisions. Record what data was used, what was decided, and what happened. This creates institutional memory and supports post-decision review.
- Embed data in rituals. Weekly team meetings, quarterly reviews, and project kick-offs should reference data as a matter of course, not as a special event.
- Incentivise curiosity. Reward teams that surface uncomfortable findings, not just those that confirm the plan.
Pro Tip: Add a standing agenda item to every senior leadership meeting: “What does the data say?” It takes two minutes and signals to the whole organisation that evidence-based reasoning is expected, not optional.

Common pitfalls and how to avoid them
A data-based decision is not automatically correct. Flawed collection or interpretation produces flawed conclusions, and the confidence that comes with a dashboard can make those conclusions harder to challenge. Validation and post-decision monitoring are not optional extras.
Common pitfalls and mitigations:
- Poor data quality: Establish data quality checks at ingestion and run regular audits. Garbage in, garbage out applies at every scale.
- Confirmation bias: Test assumptions by actively seeking data that could disprove the hypothesis, not just data that supports it. Peer review of analysis before decisions are made is a practical safeguard.
- Skills gap: Analysts and business owners often speak different languages. Cross-functional training and shared glossaries reduce misinterpretation.
- Siloed data: Fragmented systems produce fragmented insights. Integration work is a cost driver but a prerequisite for reliable analysis.
- Overfitting models: A model that performs well on historical data may fail on new data. Validate on held-out data sets and monitor model drift in production.
- Overreliance on quantitative data: Numbers rarely tell the whole story. Qualitative context, customer feedback, and domain expertise must sit alongside the model output.
UK compliance note: Any programme collecting or processing personal data must comply with the UK GDPR and the Data Protection Act 2018. Data minimisation, purpose limitation, and subject rights are legal obligations, not best-practice suggestions. Confirm your data governance framework with a qualified data protection officer before processing personal data at scale.
What to measure: KPIs that show your programme is working
Leading indicators tell you whether the programme is being adopted. Lagging indicators tell you whether it is producing results. You need both: leading indicators give you time to course-correct; lagging indicators confirm whether the investment was justified.
| KPI | What it shows | How to measure |
|---|---|---|
| Decision cycle time | Speed of evidence-based decisions | Time from question raised to decision recorded |
| Data adoption rate | Proportion of decisions referencing data | Audit of decision logs over a quarter |
| Analysis accuracy | Reliability of model or analyst outputs | Predicted vs. actual outcomes, reviewed post-decision |
| Data quality score | Health of source data | Completeness, accuracy, and timeliness checks at ingestion |
| Programme ROI | Financial return on DDDM investment | Cost savings or revenue gains attributed to data-led decisions |
Recommended evidence sources and review cadence:
- Decision logs reviewed monthly by programme lead
- Dashboard adoption metrics from your BI platform, reviewed quarterly
- Post-decision outcome reviews at 30, 60, and 90 days after major decisions
- Data quality reports monitored continuously and summarised monthly
- ROI assessments reviewed biannually or after major programme milestones
If you only measure business outcomes, you will spot problems too late. If you only measure adoption, you may mistake activity for impact. The discipline is in tracking both.
Which tools and platforms should you consider?
Tools do not create a data-driven organisation on their own, but the right stack can remove friction. For most organisations, the practical question is not “Which platform is best in the abstract?” but “Which platform fits our data maturity, governance needs, and operating model?”
In the UK market, commonly considered options include visual analytics platforms, cloud data warehouses, ETL tooling, and governance layers that help teams trust what they are seeing.
Common categories to evaluate:
- Business intelligence and visualisation: Tableau, Microsoft Power BI, and Looker are often used to make data accessible to non-technical stakeholders.
- Enterprise analytics suites: IBM Analytics and similar platforms can support more advanced modelling, governance, and enterprise reporting requirements.
- Data integration and pipeline tooling: Fivetran, Airbyte, dbt, Azure Data Factory, and custom integrations help move and transform data reliably.
- Storage and compute layers: Snowflake, BigQuery, Azure Synapse, and AWS-native services support scalable analysis.
- Governance and cataloguing: Data catalogues, lineage tools, and access controls help teams understand what data exists and whether it is safe to use.
Selection criteria that matter more than feature lists:
- Integration fit: Can the platform connect to your actual systems, not just the ones shown in the demo?
- Governance support: Can you control access, document definitions, and audit usage?
- User adoption: Will business teams actually use it without depending on specialists for every answer?
- Total cost: Include implementation, training, integration, and ongoing support, not just licence fees.
- Scalability: Can the platform support more users, more data, and more use cases without a redesign?
For mission-critical environments, the best answer is often a hybrid one: use proven commercial tools where they fit, and build custom integration or operational layers where the environment demands it.
Where DDDM adds clear value: practical use cases
DDDM is most persuasive when tied to decisions people already care about. The following use cases show where evidence-led decision processes create visible operational value.
- Operations: Predictive maintenance, downtime reduction, capacity planning, and incident prioritisation all improve when telemetry and historical performance data are analysed systematically.
- Sales and marketing: Lead scoring, campaign attribution, pricing optimisation, and churn prevention become more precise when behavioural and commercial data are connected.
- Finance: Forecasting, spend control, working capital management, and scenario planning benefit from consistent data definitions and timely reporting.
- HR and workforce planning: Attrition analysis, hiring pipeline performance, and training effectiveness can be measured rather than guessed.
- Health and safety: Sensor data, inspection records, and incident trends can identify elevated risk before an event occurs.
The strongest early use cases usually share three characteristics: they matter to the business, they have a measurable outcome, and the data required is already available or can be collected without major delay.
PODTECH’s practitioner perspective on DDDM in mission-critical systems
In mission-critical environments, data-driven decision making is not a management slogan. It is an operational requirement. When systems support safety, uptime, compliance, or infrastructure resilience, the cost of acting on incomplete information rises sharply.
PODTECH’s perspective is shaped by environments where data comes from multiple operational systems, arrives at different frequencies, and must be interpreted in context. In these settings, the challenge is rarely a lack of data. It is making that data trustworthy, timely, and usable by the people who need to act.
That means:
- Integrating fragmented sources so operators can see a coherent picture rather than isolated signals
- Designing for action so dashboards and alerts support real operational decisions rather than passive reporting
- Maintaining governance so data lineage, access, and accountability are clear
- Closing the loop so outcomes are reviewed and the system improves over time
In practice, the organisations that benefit most are not the ones with the most sophisticated models on paper. They are the ones that connect data to operational workflows and decision ownership.
Realistic timelines and the cost drivers you need to plan for
One reason DDDM programmes disappoint is unrealistic planning. Leaders often budget for dashboards but not for the integration, governance, and change management work that makes those dashboards useful.
Typical cost drivers include:
- Data integration: Connecting legacy systems, APIs, spreadsheets, and telemetry sources is often the largest hidden cost.
- Data quality remediation: Cleaning, standardising, and validating source data takes time and specialist effort.
- Platform licensing and infrastructure: BI tools, storage, compute, and orchestration all carry recurring costs.
- Training and adoption: Teams need support to interpret outputs and use them in routine decisions.
- Governance and compliance: Access controls, auditability, and privacy processes are essential, especially where personal or sensitive data is involved.
A realistic delivery pattern often looks like this:
- Weeks 1–4: Define the decision use case, sponsor, success metrics, and data sources.
- Weeks 4–8: Establish access, build initial pipelines, and assess data quality.
- Weeks 8–12: Produce first analysis, validate assumptions, and create decision-ready outputs.
- Months 3–6: Operationalise the workflow, review outcomes, and expand to adjacent use cases.
Enterprise-wide maturity takes longer, but a focused pilot can produce useful evidence quickly if the scope is disciplined.
Your first actions: a checklist to start this week
If you want momentum rather than another strategy document, start small and make the first week concrete.
- Choose one decision that matters and can be improved with better evidence
- Name an owner who is accountable for the decision and its outcome
- Write the objective clearly with a measurable target and timeframe
- List the data sources you already have and identify obvious gaps
- Check data quality early before anyone builds a dashboard
- Agree the KPI set that will show whether the decision improved outcomes
- Set a review date so the team learns from the result rather than moving on
The point is not to prove that data can answer every question. It is to prove that a disciplined evidence-led process can improve one important decision now.
Key takeaways
- DDDM is a discipline, not a dashboard. It links objectives, data, analysis, decisions, and review.
- The business value is practical. Reduced uncertainty, faster decisions, better alignment, and stronger predictive capability.
- Implementation succeeds when scope is tight. Start with one decision and one measurable outcome.
- Culture matters as much as tooling. Literacy, access, sponsorship, and decision documentation are essential.
- Governance is not optional. Data quality, privacy, and accountability determine whether insights can be trusted.
The gap between data ambition and data reality
Many organisations say they want to be data-driven, but their operating reality tells a different story. Data lives in silos. Definitions vary by team. Reports arrive too late. Dashboards exist, but decisions still default to hierarchy or habit.
Closing that gap requires more than enthusiasm. It requires operational discipline:
- Shared definitions so teams are not arguing over what a metric means
- Reliable pipelines so data arrives consistently and on time
- Decision ownership so insights lead to action rather than observation
- Review loops so the organisation learns what worked and what did not
The ambition is easy to state. The reality is built through repeated, well-governed decisions that improve over time.
PODTECH brings data-driven decisions to mission-critical infrastructure
At PODTECH, we work in environments where data is only valuable if it supports action. That means integrating operational systems, structuring data for trust and usability, and delivering outputs that help teams make better decisions in real time.
Whether the challenge is infrastructure visibility, safety monitoring, operational analytics, or decision support in complex estates, the principle is the same: connect the right data to the right decision at the right moment.
If your organisation is trying to move from fragmented reporting to dependable, evidence-led operations, the first step is not buying more dashboards. It is defining the decision that matters most and building the data process around it.
Useful sources and further reading
- Coursera: Data-driven decision making
- Harvard Business School Online: Data-driven decision making
- PODTECH SiteChief.com case study
- UK Information Commissioner’s Office (ICO)
- UK Government guidance on data protection
Final thought
Data-driven decision making is not about removing judgement from leadership. It is about improving judgement with evidence. The organisations that do it well are not the ones with the most data. They are the ones that ask better questions, trust their inputs, and learn from outcomes with discipline.